I have written numerous articles about ASP.NET and creating memory dumps, but noticed I had not written one specifically about capturing an ASP.NET Core memory dump on an Azure App Service. Here are some of my ‘related’ articles of this matter.
- Create a memory dump for your slow performing Web App
- How to take a memory dump from a specific App Service instance
- Create and deploy an ASP.NET Core Web API to Azure Windows (see Figure 4)
- ASP.NET and ASP.NET Core Application Restarts on Azure App Service
- What do C# values look like in WinDbg
- Must use, must know WinDbg commands, my most used
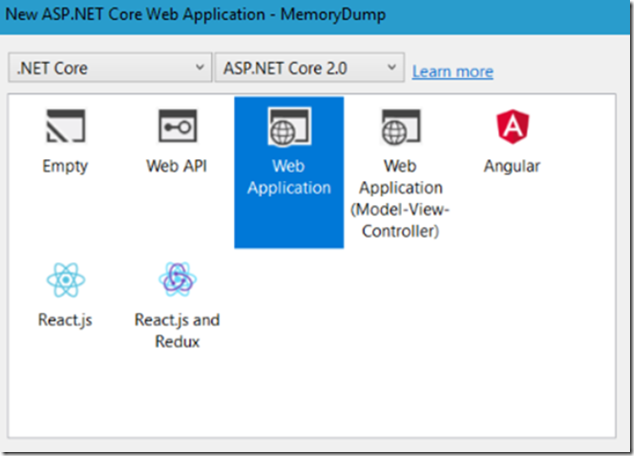
I created an ASP.NET Core 2.0 application in Visual Studio 2017, like that shown in Figure 1.
Figure 1, create an ASP.NET Core 2.0 application, simple
Inside the Index.cshtml.cs file I added the infamous Sleep() method to make sure performance is not very good. And indeed it is slow, 5 seconds exactly.
public class IndexModel : PageModel
{
public void OnGet()
{
System.Threading.Thread.Sleep(5000);
}
}
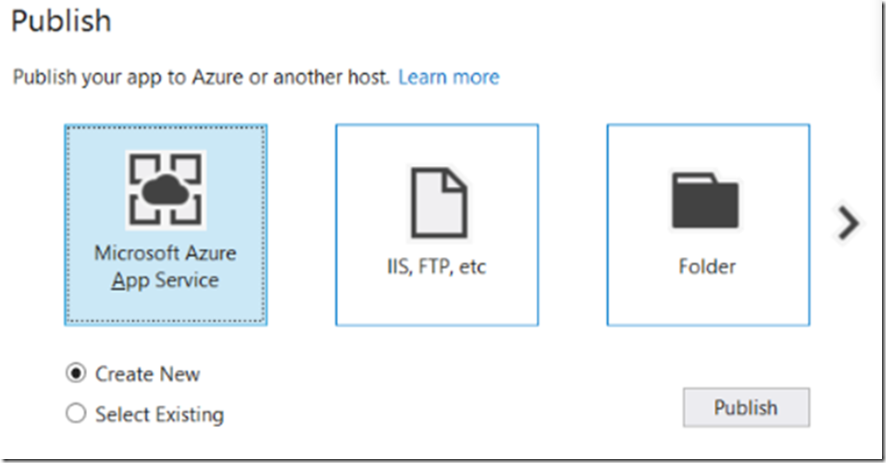
Then I published the project out to an Azure App Service via Visual Studio 2017, Figure 2, by right-clicking the project –> Publish and followed the wizard where I selected the subscription, resource group and app service plan, I show a figure of that relationship here.
Figure 2, how to publish an ASP.NET Core 2.0 application, simple, to Azure App Service
After it published I accessed KUDU / SCM as I explained here, and navigated to the Process Explorer Tab. As Seen in Figure 3.
Figure 3, troubleshoot an ASP.NET Core 2.0 application, simple, on Azure
I reproduced the issue, right-clicked the DOTNET.EXE –> Download Memory Dump –> Full Dump, Figure 4. Note that the issue must be happening at the time the dump is taken in order for the issue to be seen in the dump. A dump is just a snapshot of what is happening at the time it is taken.
Figure 4, troubleshoot / memory dump an ASP.NET Core 2.0 application, simple, on Azure
I tried to have 5 request running at the time I took the memory dump, let’s see how it looks.
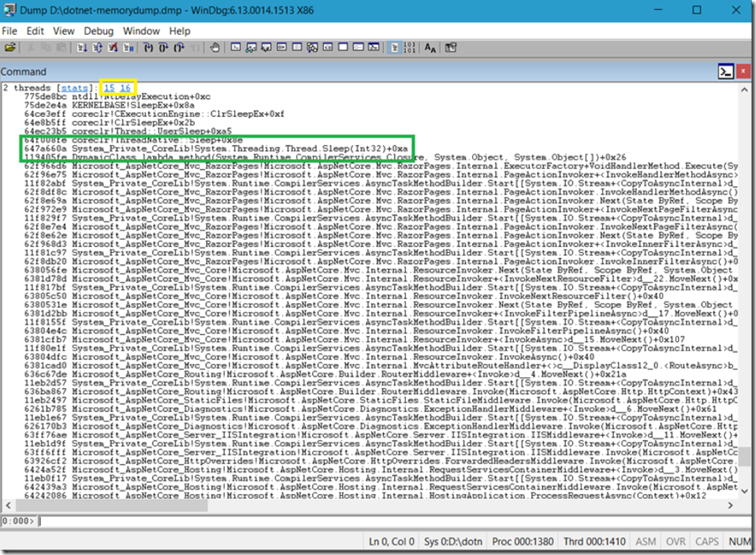
If you have not already seen my article “Must use, must know WinDbg commands, my most used”, then check it out here. As seen in Figure 5, running !mex.us grouped thread 15 and 16 together as they had the same stack patterns. I found 1 other thread that was running my request, but the stack was a little different so it didn’t make that group.
Figure 5, troubleshoot / analyze a memory dump of an ASP.NET Core 2.0 application, simple, on Azure
Like always, it is easy to find the problem when you coded it on purpose, but the point is, if you see a lot of threads doing the same thing in the process and when you took the dump there was high CPU or high latency, it is highly probable that the method at the top of the stack is the one that needs to be looked into more.
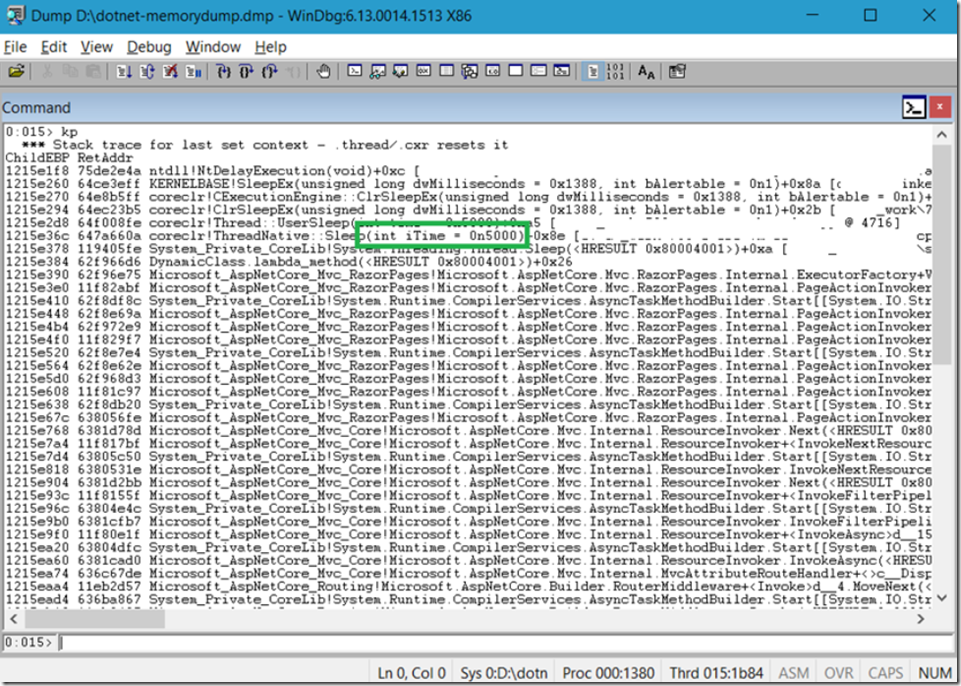
An added tip, to see the value of the Int32 that is passed to the System.Threading.Thread.Sleep() method, as that is managed code, you can decompile the module and then look at the code, but if you didn’t want to do that you can execute kp, as seen in Figure 6.
Figure 6, troubleshoot / analyze a memory dump of an ASP.NET Core 2.0 application, simple, on Azure
Had it been a heap variable you can use !sos.dso and you’d see it stored on the heap, however, we all know that Integers are not stored on the heap right(*)?


