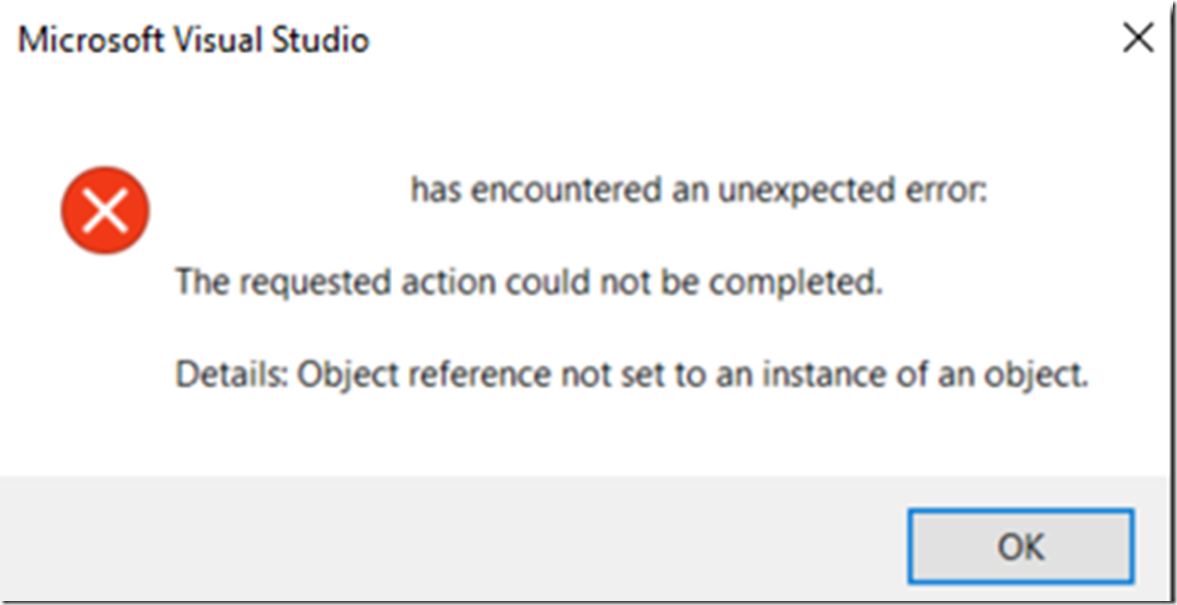
Just documenting something I did today. I was receiving the error shown in Figure 1.
“??? has encountered an unexpected error: The requested action could not be completed. Details: Object reference not set to an instances of an object.”
Figure 1, Object reference not set to an instances of an object exception
I needed to find out what the exception stack was/is so that I could notify the responsible people about this issue. What I did was use Procdump which I have written many articles about of the years, however, in this case I am using a feature that I call out here. Specifically, the –f parameter, for example:
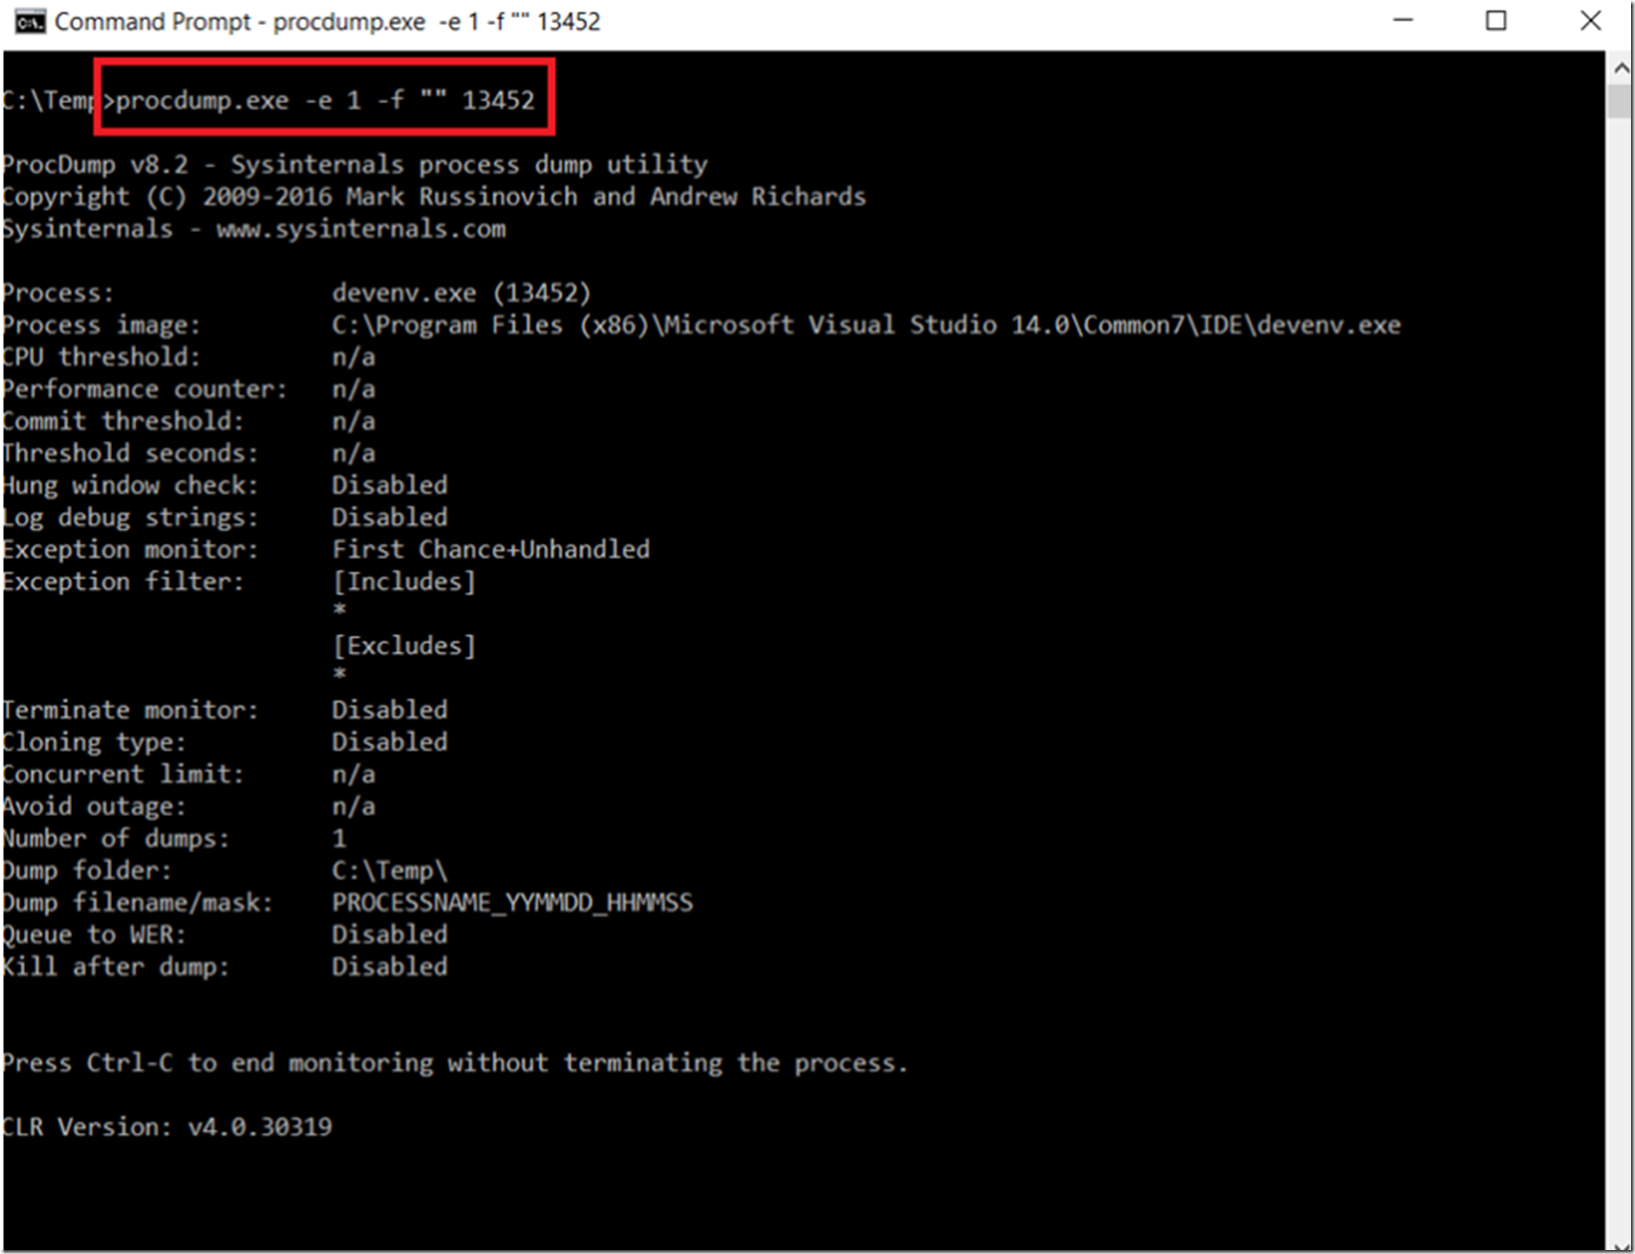
C:\Temp\procdump –e 1 –f “” <PID>
First thing is I needed to find the PID of the process which was throwing the exception. Open Task Manager and find it in the Details tab. In this case it was 13452. I executed the command and got the below output, Figure 2. My intent here is to find which exception is being thrown so that I can then capture a memory dump when that exception is thrown from that process.
Figure 2, find out what exception is being thrown in a process
Then I reproduced the issue and saw that it was a System.NullReferenceExcption, Figure 3. Specifically I saw:
Exception: E0434F4D.System.NullReferenceException (“Object reference not set to an instance of an object.”)
I also see the E0434F4D.System.AggregateException (“One or more errors occurred.”), but will focus on the NullReferenceException for now.
Figure 3, findings the exception stack of a process
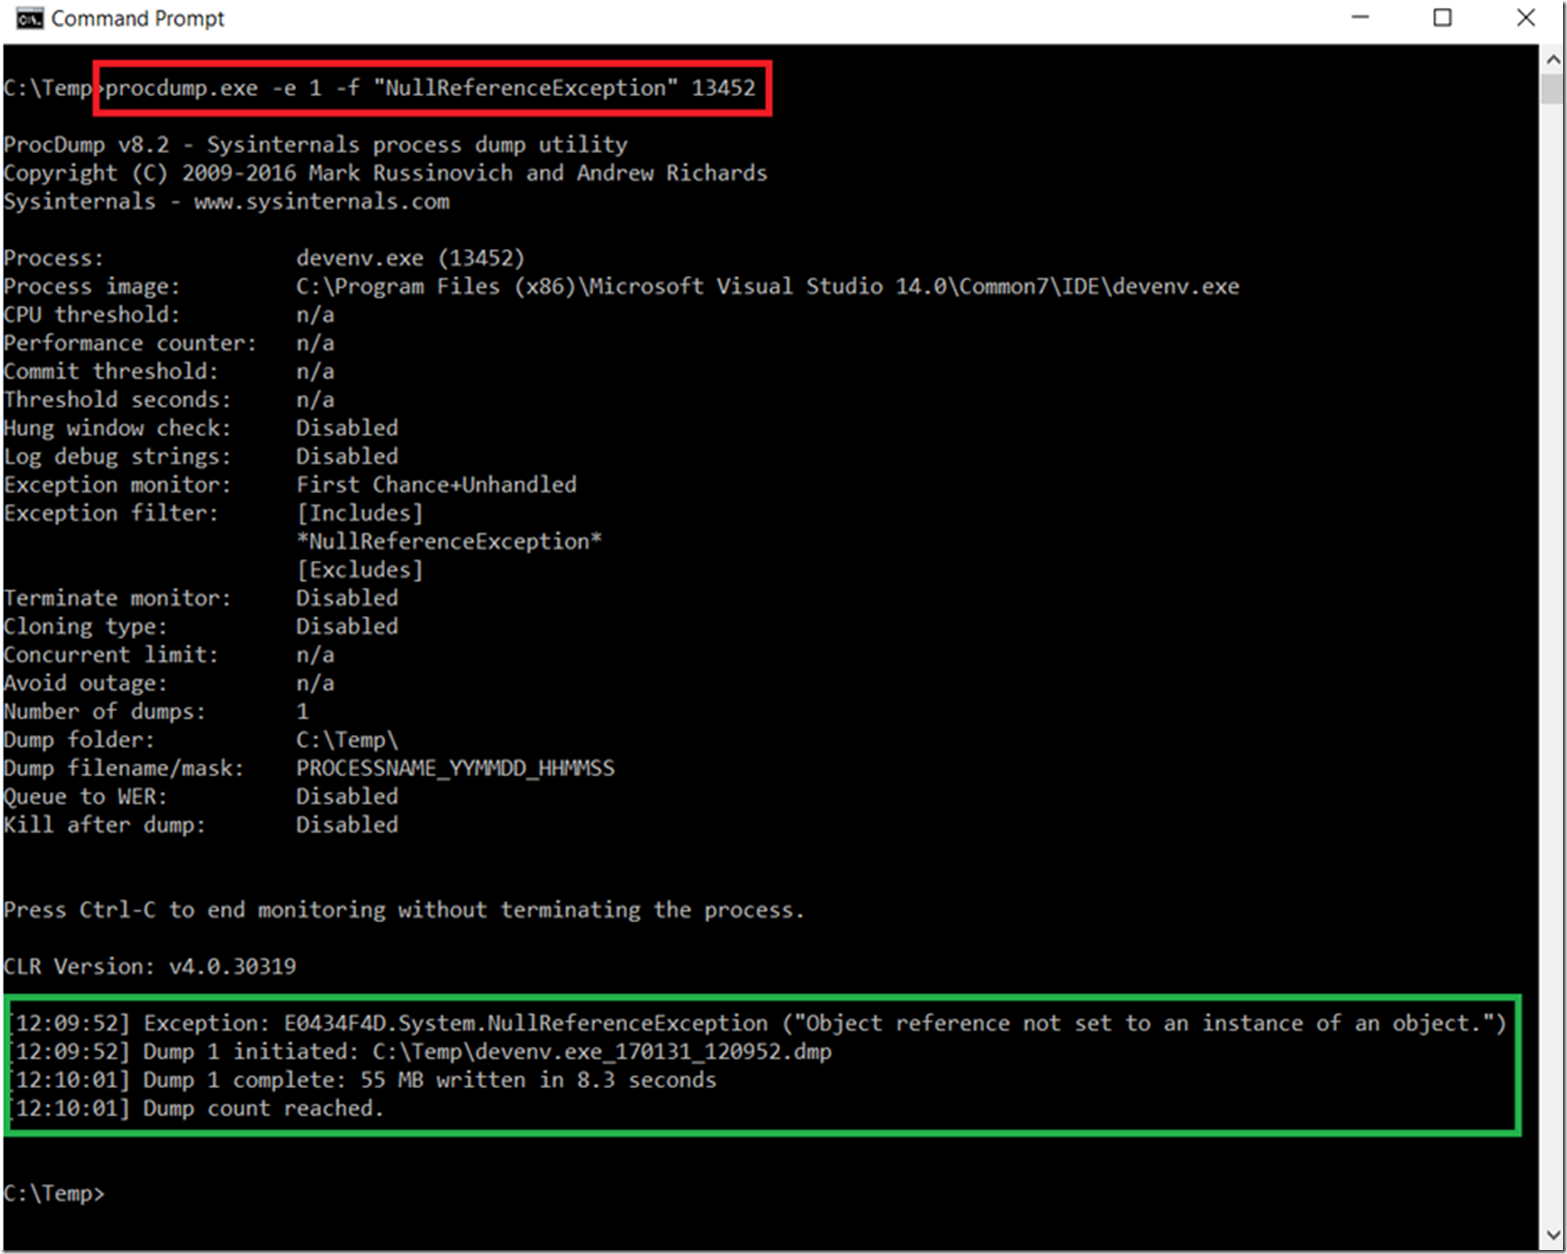
Now I need to capture a dump when that exception is thrown, I use this command, also shown in Figure 4:
C:\Temp\procdump –e 1 –f “NullReferenceException” <PID>
Figure 4, capture a memory dump for a specific exception
Next, analyze the memory dump in WinDbg or Debug Diagnostic. Also, I like to use the MEX debugging extension as described here. Here are a number of links that explain how you can analyze the memory dump.
- Analyze a memory dump using the Debug Diagnostic tool
- Debugging a hung application with WinDbg
- New ProcDump version 5.0 released, using the –f parameter
- Create a W3WP memory dump, quick and easy
- IIS Debugging Labs – Information and setup instructions
- MEX Debugging Extension for WinDbg


