Once you have captured a memory dump, instead of, or in addition to using WinDbg to analyze the memory dump, you can use a tool called DebugDiag which can be downloaded here. I discuss how to capture a memory dump in numerous ways here.
After installing the debugging tool, make sure have opened the Debug Diag Analysis Tool (I.e. not the Collection Tool) and add the memory dump by selecting the Add File Button, select the Rule Name for the kind of analysis you want to run on the memory dump and then click on Start Analysis as discussed in Video 1 (removed).
Video 1, use debug diag to analyze a memory dump
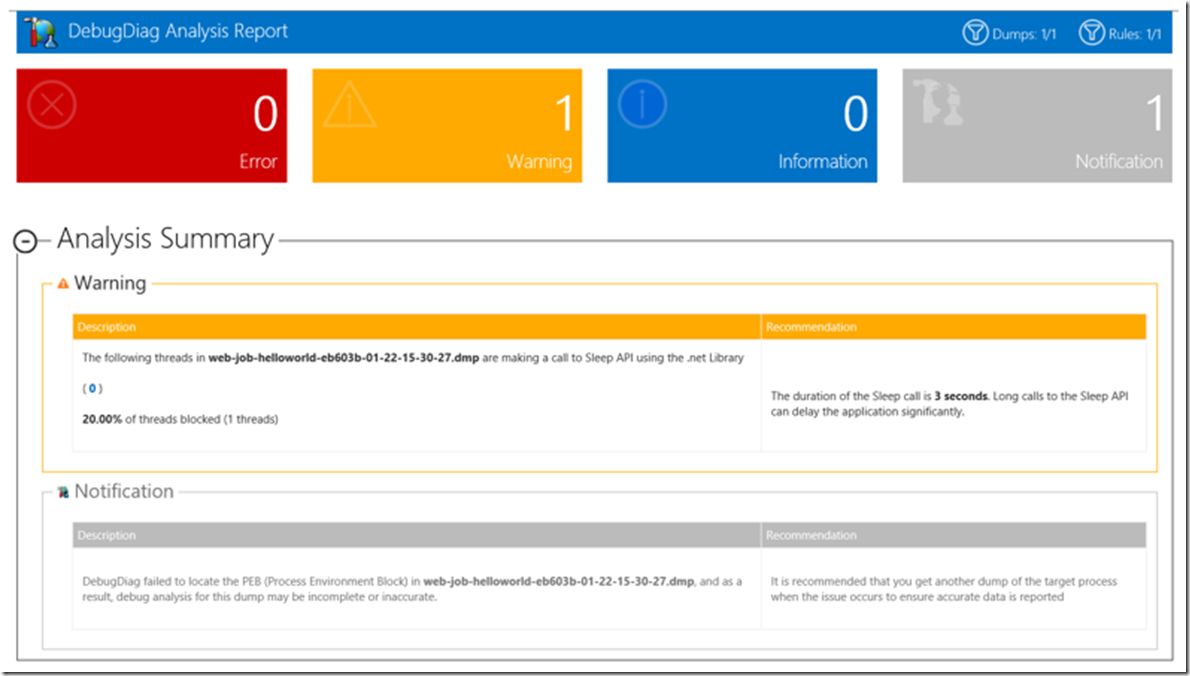
Once the analysis is complete, a report is generated similar to that shown in Figure 1.
Figure 1, Debug Diag analysis report
Scroll down the report and you can see, depending on the selected analysis rule, the threads, stacks and the objects consuming the most amount of memory.
NOTE: I wrote more details about this memory dump analysis using WinDbg here.
