I really like to use ProcDump for troubleshooting crashes, memory/cpu utilization issues and hangs. I have written a number of other blogs that discuss how to use it here, here and here.
The tool is small and unobtrusive, yet very powerful. The new version of the tool has recently been released and can be downloaded from here.
One of the new features that I really like is the –f parameter. This parameter lets you filter on a specific exception. The –f parameter must be used in combination with the –e 1 which will create a memory dump when the exception happens. You can read the description on the ProcDump download page for the specific definition and description.
For this example I downloaded, installed and configured BuggyBits and also created a simple ASP.NET website that attempts to write a file to a directory (using System.IO;) which it does not have access to.
BuggyBits
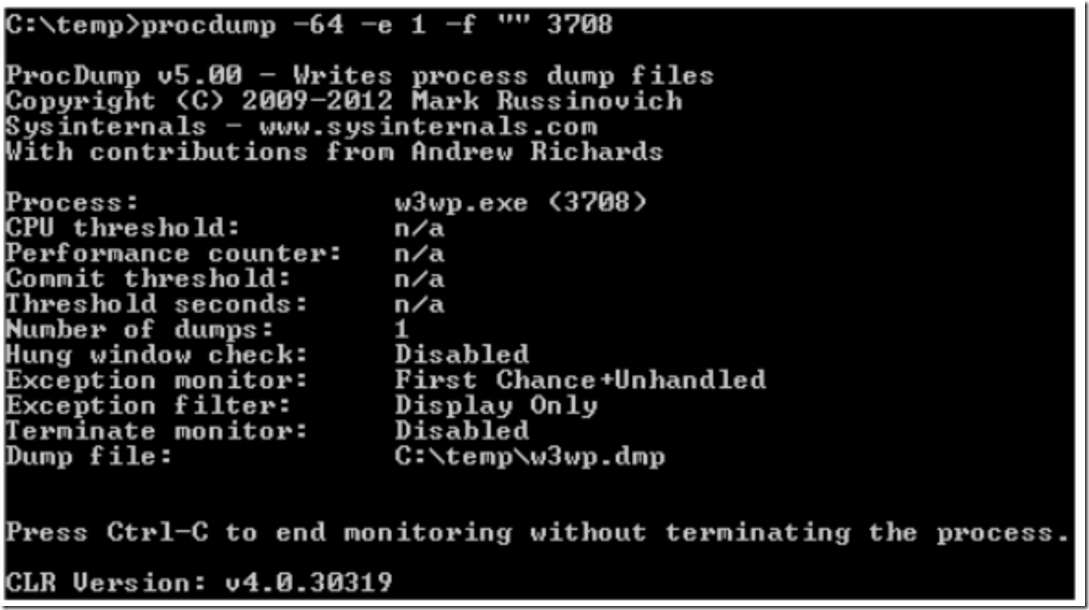
I started up BuggyBits, retrieved the PID and setup the ProcDump command as shown in Figure 1. The PID is the Process ID associated with the W3WP worker process running the BuggyBits web site.
Figure 1, ProcDump using the –f parameter
The command I used is (note: add -ma for a full memory dump):
C:>procdump -64 –e 1 –f “” 3700
This means that I want to catch all exceptions that happen within the worker process. I then select the Refresh button within the Reviews page. This throws an exception which gets logged to the command window, as shown in Figure 2.
Figure 2, ProcDump exception logged to command window
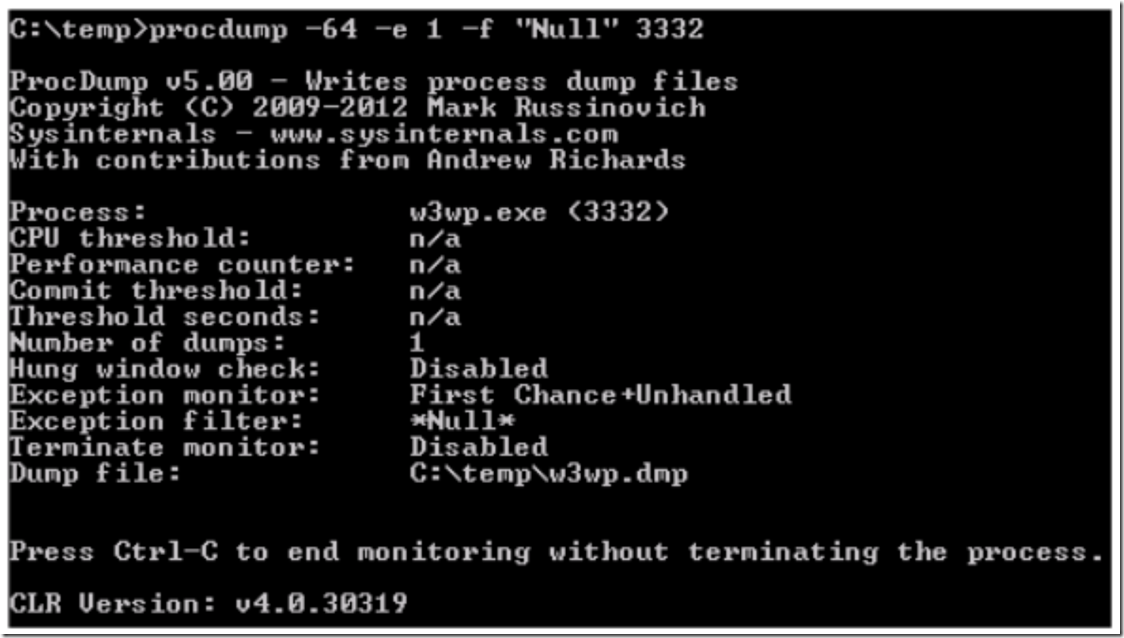
Next, I can configure ProcDump to create a memory dump when that exception happens, by executing the following, as shown in Figure 3. Notice that I have included the search ‘wildcard’ of “Null”.
Figure 3, ProcDump using the –f parameter and wildcard
The command I used is (note: add -ma for a full memory dump):
C:>procdump -64 –e 1 –f “Null” 3332
When an exception happens within the worker process with PID = 3332 that contains “Null” in it, a memory dump is created, as shown in Figure 4.
Figure 4, ProcDump creates a memory dump
Now you can use WinDbg to review the memory dump and try to find out what is causing the NullReferenceException.
CreateFile
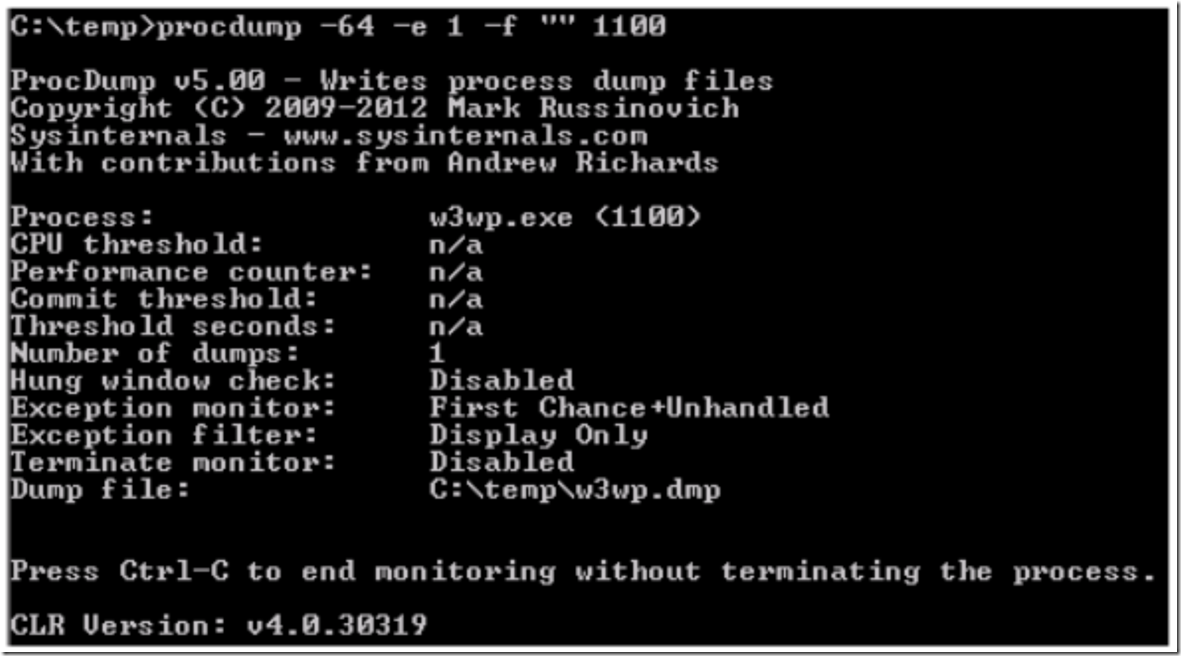
As mentioned already, this simple ASP.NET web site attempts to create a file in a directory which it does not have access to. I start by setting up ProcDump to monitor this worker process running the CreateFile website, by using the command shown in Figure 5.
Figure 5, Using ProcDump to monitor for W3WP exceptions
The command I used is (note: add -ma for a full memory dump):
C:>procdump -64 –e 1 –f “” 1100
In this case, 1100 is the Process ID of the worker process handling requests for this web site. I run the code that attempts to create the file and the exceptions are logged to the command window as shown in Figure 6.
Figure 6, ProcDump logging exceptions
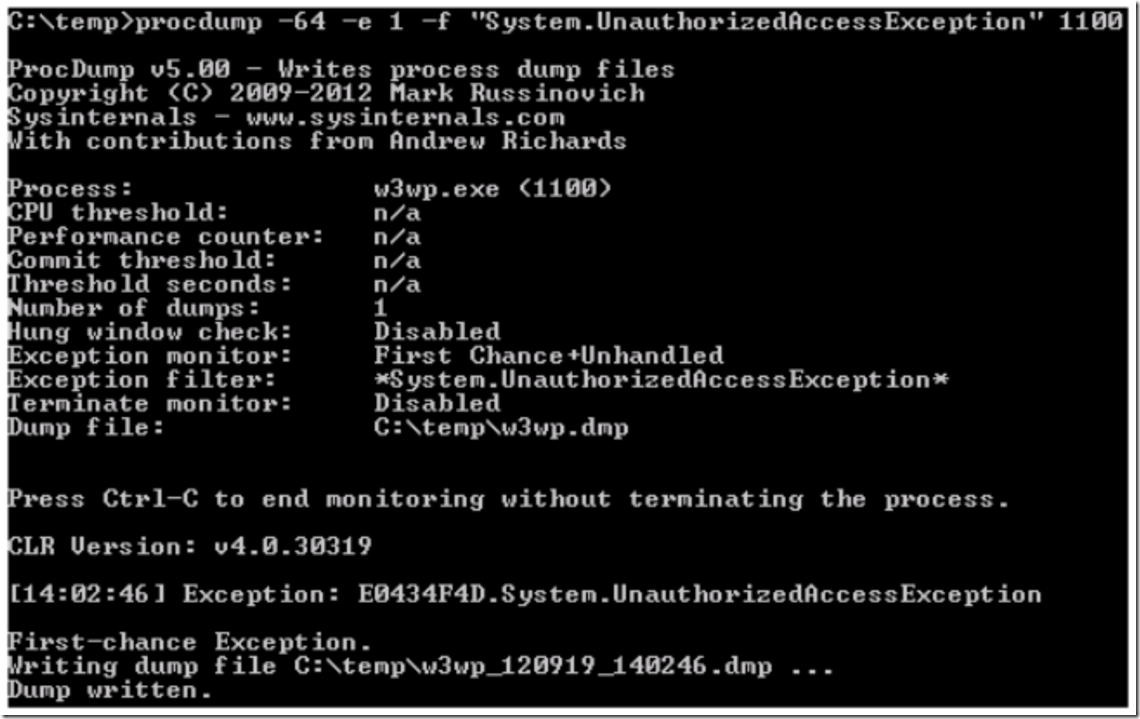
I can now configure ProcDump to create a memory sump when the System.UnauthorizedAccessException happens, by entering the following command and executing the code within the website again. Figure 7, shows the configuration and result.
Figure 7, creating a memory dump using ProcDump version 5.0 for a specific exception
The command I used is (note: add -ma for a full memory dump):
C:>procdump -64 –e 1 –f “System.UnauthorizedAccessException” 1100
We can take the memory dump and use WinDbg to find out which method and perhaps the line of code which is triggering this exception. See Figure 8 which shows the results of the memory dump analysis.
Figure 8, Analyzing a ProcDump memory dump using WinDbg
Note that in Figure 8 I see that the exception is likely being thrown from the Page_Load() method of the Default file. Within this method, the code is calling the CreateDirectory() method in the System.IO class. I also see that that specific ASP.NET file has been compiled into a DLL named App_Web_wqd5pp1a.dll.
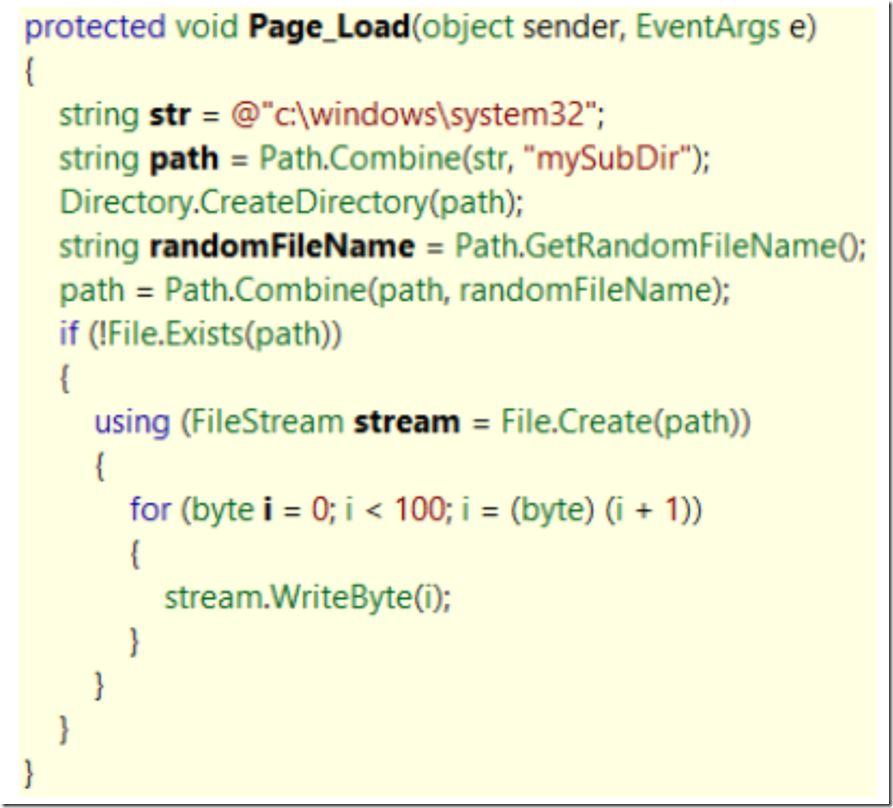
I can decompile the component and look at the code, as shown in Figure 9.
Figure 9, decompiled code causing the exception
Now you can see what the code is trying to do, determine if you need to grant the permission or request a code change from the developers…or make the code change yourself.
NOTE*: Consider using the –ma parameter so that a complete memory dump is created and not a mini-dump. Take notice that the size of the file will be much larger.
