This has been my favorite WinDbg extension for a long time and I am very happy to see that it has been made public. It can be downloaded from here.
To load the MEX extension, copy the MEX.DLL into the winext directory under which your WinDbg client is running. It can be placed any where as long as you reference it via the path. To load it using the .load mex command as shown in Figure 1, it needs to be in the winext directory.
Figure 1, MEX Debugging Extension for WinDbg
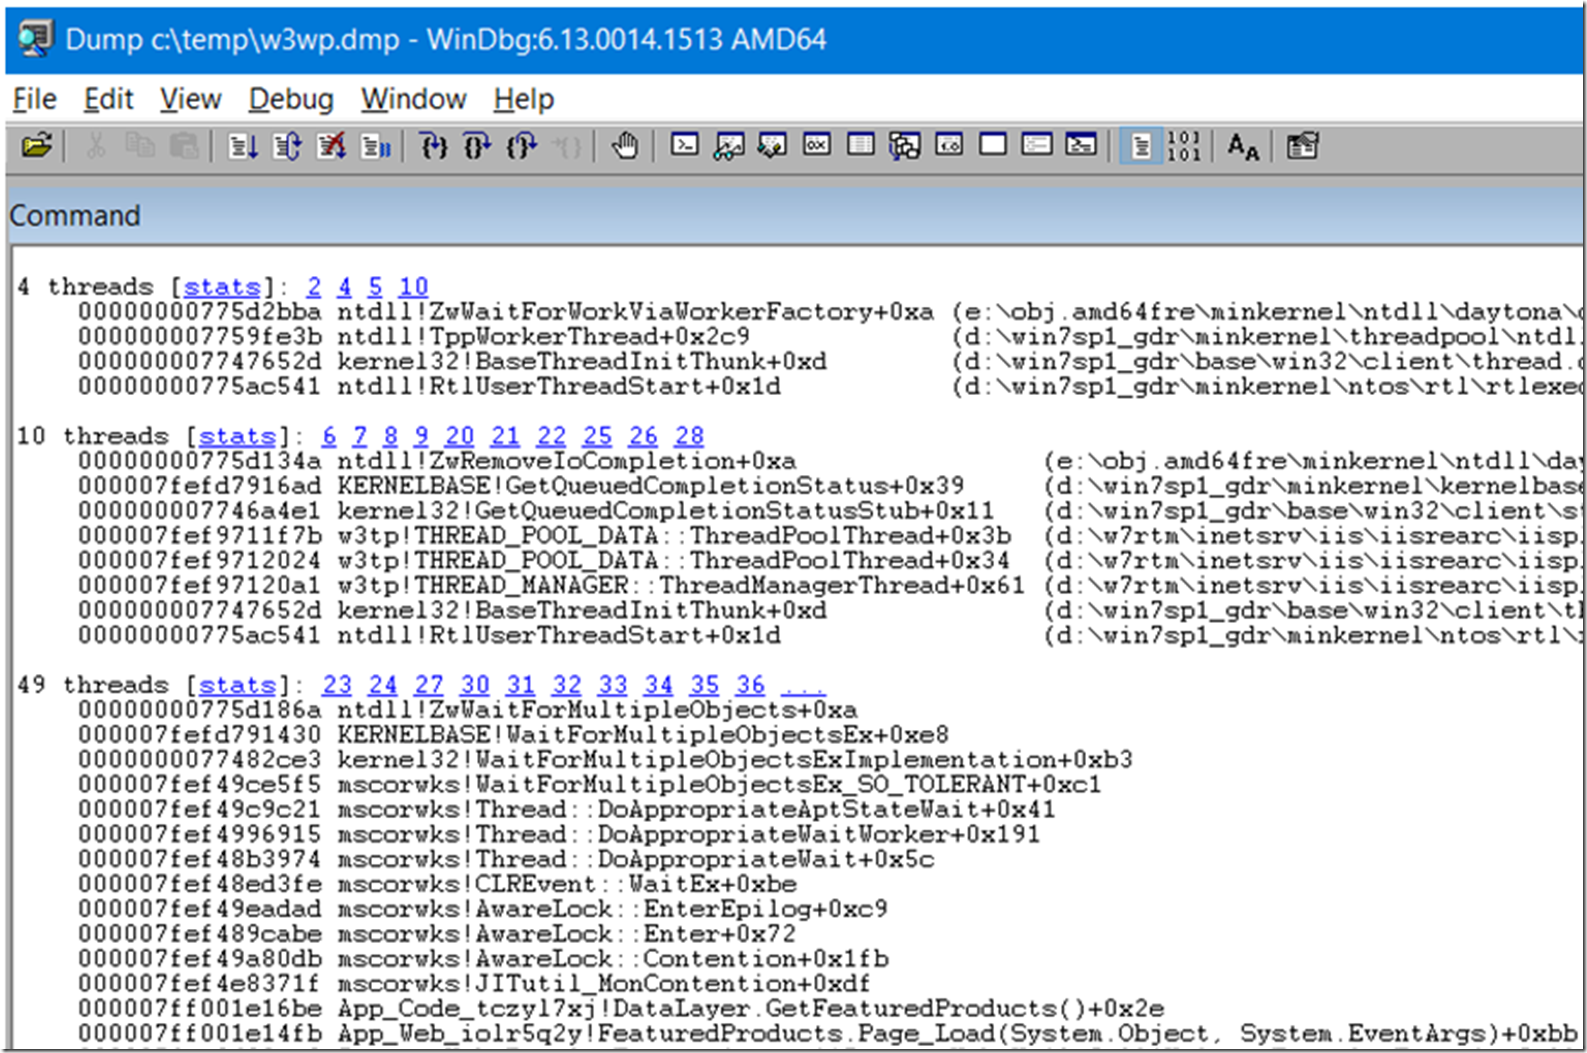
Prior to MEX when I reviewed a memory dump I dumped out all the threads using something like ~*clrstack, but that required me to then scroll up and look for patterns in the stacks manually. My favorite MEX command is !mex.us, which groups all the threads with similar stacks into a group. This saves a lot of time. As shown in Figure 2, I can see that there are 49 threads with the same stack coming from a method called GetFeaturedProducts().
Figure 2, using MEX to group together matching stacks on threads
If you want to view all the commands available in the MEX extension, then you can run the !mex.help command as seen in Figure 3.
Figure 3, what functions are available in MEX for working with WinDBG
I will also start using this WinDbg extension in my IIS labs from now, in those labs where I look at a memory dump.


