If you can reproduce the slow running WebJob behavior you have hosted with your Azure App Service Web App, Mobile App or API App then you can find out why using the following article. Additionally, if the WebJob is in a hung state, skip right to the portion where you take the memory dump of the WebJob process and then debug it, see Video 1.
For simplicity, I have created a WebJob which you can download here, that sleeps for 3 seconds, 10 times within a for loop. The WebJob is a Triggered (not continuous) which I kick off from within the Azure Management Console. If the WebJob is continuous and is hung or slow, you can take a memory dump as well. NOTE: It is also possible to trigger the WebJob using an API call as discussed here. Additionally, I wrote an article here that explains how I called the WebJob API to run it and the source code here.
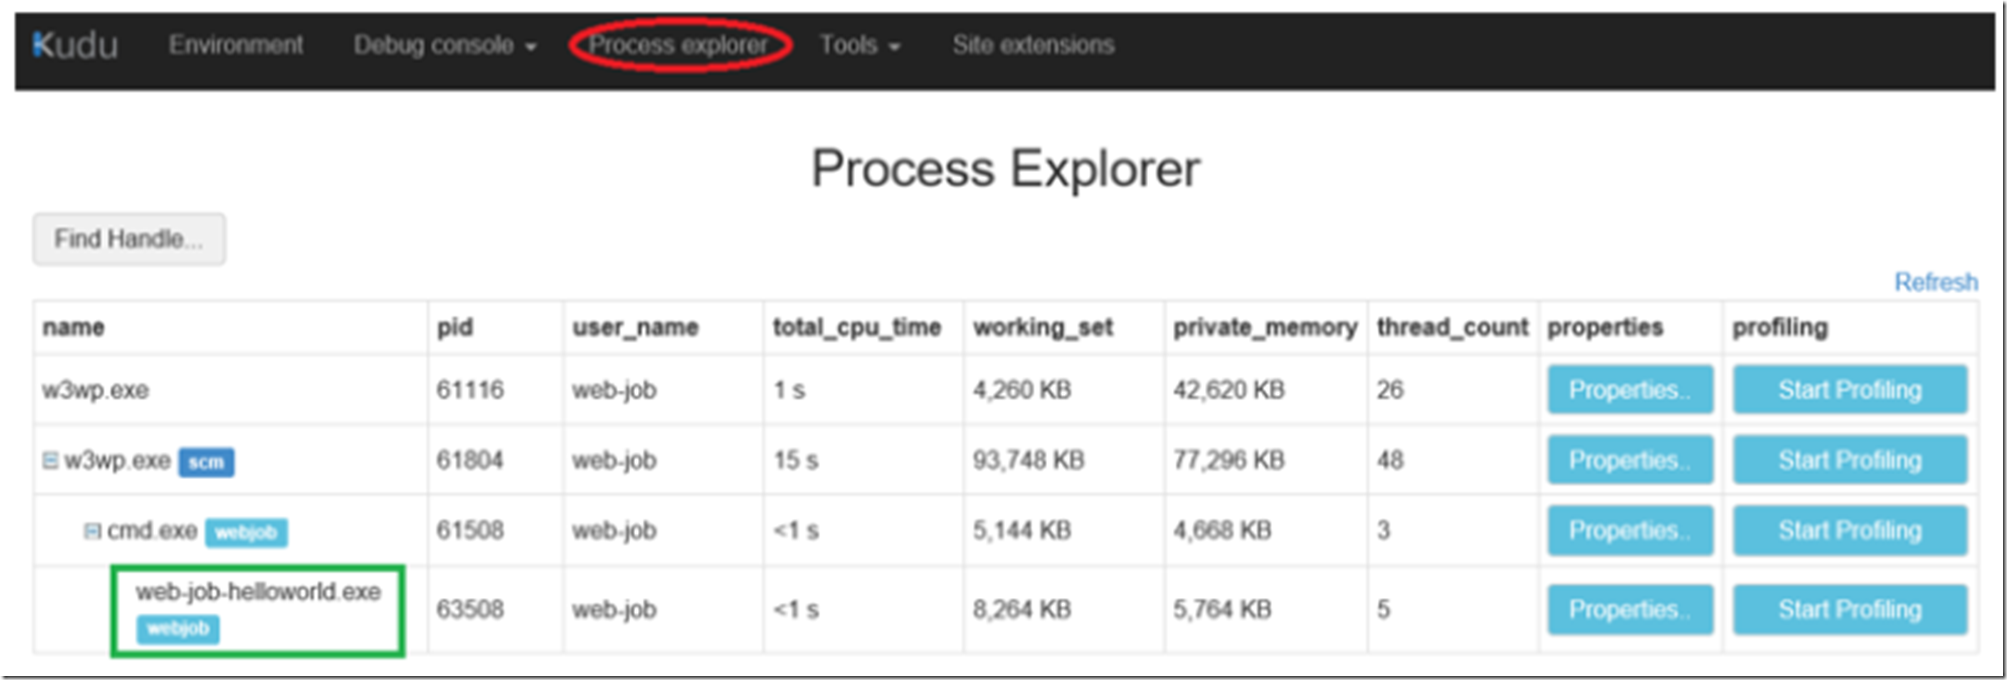
Once the WebJob is running and the slowness or hanging is happening, access the KUDU console, which I discuss here and click on the Process Explorer link as shown in Figure 1.
Figure 1, viewing the processes, Web App, Mobile App, API App, KUDU, when WebJob is EXE
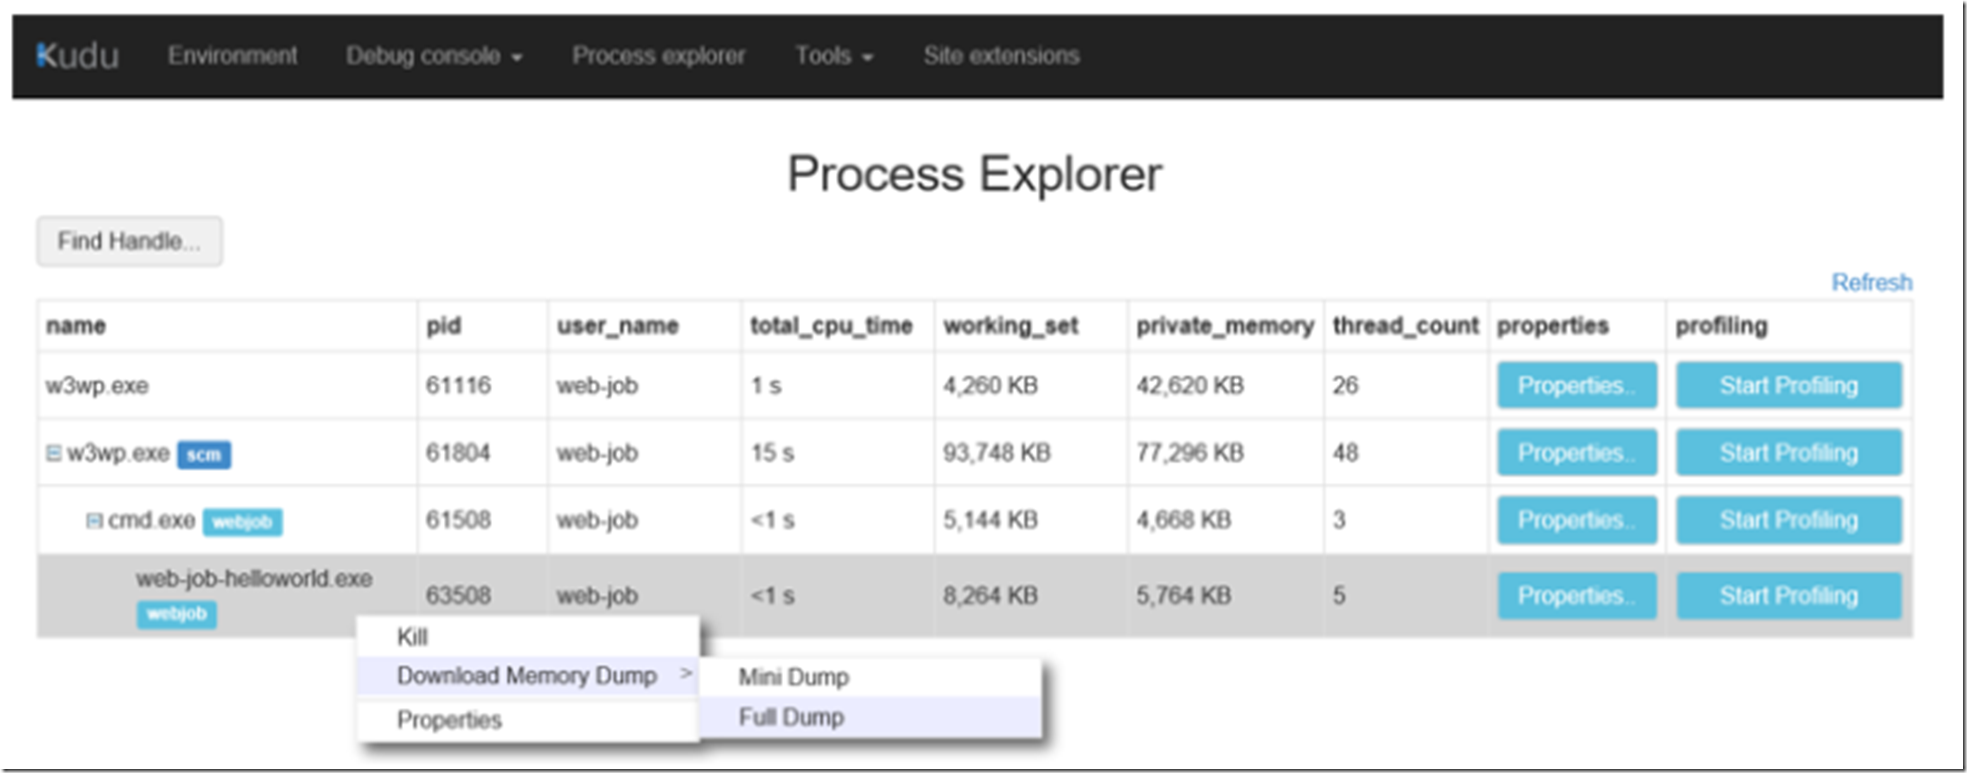
Figure 2, viewing the processes, Web App, Mobile App, API App, KUDU, when WebJob is CMD
Notice in Figure 1 that the running WebJob is displayed by name. As shown in Figure 2 and explained via Video 1, take a memory dump of the EXE.
Figure 3, take a memory dump of the slow or hung WebJob
It might take a moment or two create the memory dump, but after some moment you are prompted to download the DMP file. If you have problems with it, I make a NOTE here about what may be the problem.
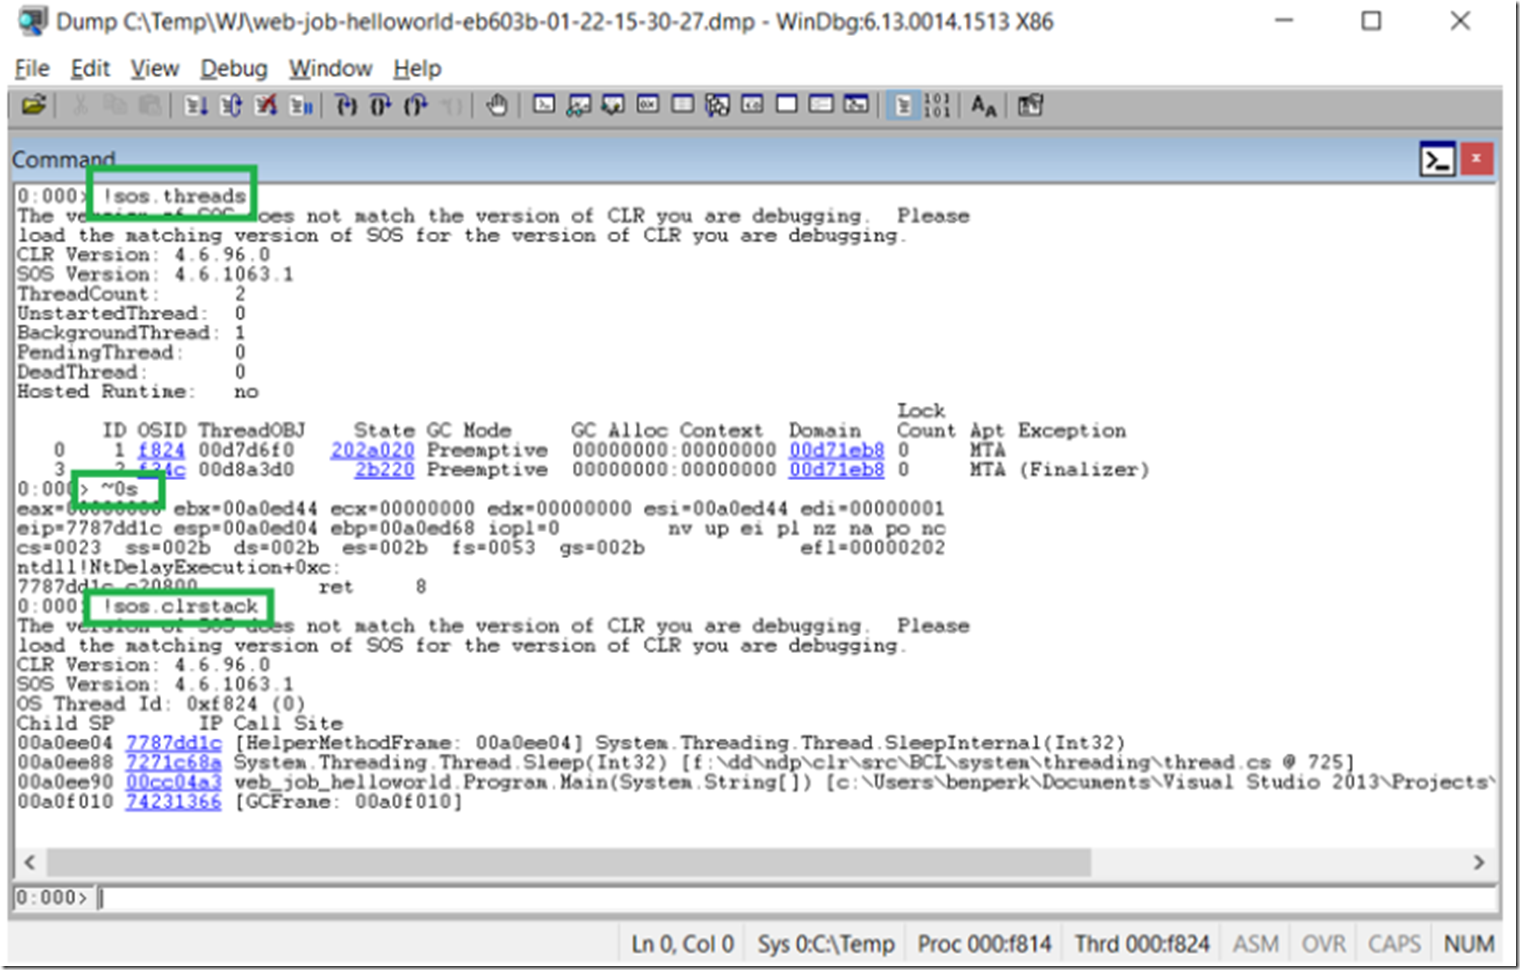
Open the memory dump in WinDbg as shown in Figure 3. I provide more details about debugging a memory dump from a Web App here. After getting loading the SOS.dll, as show here (see Figure 2 and 3 there), enter the commands, also shown in Figure 3 below and explained in more detail in Video 2.
- .load \sos.dll -> to load the debugger extension
- !sos.threads -> to list the threads running in the process
- ~#s -> to change focus to that thread, note that # is replaced by the thread number
- !sos.clrstack -> to list the stack of that thread
Figure 4, why is my WebJob hanging or slow?
Yes, i do understand that this is a simple example, however, you can uncover the reason for the hang or slowness following the same approach.
In the case you have more thread, just change focus to each thread (~#s) and view the stacks of each (!clrstack). See, the analysis of a memory dump is not something you can write a textbook about, you need to know something about what is happening in the process, do some detective work and pull the clues together to get a picture of what is going on.
After you have viewed all the stacks, you might have found one that looks a little conspicuous. You would want to look at the method closest to the top and see what it is doing, like what I mentioned in Video 2. Looking at the stack in Figure 3, you notice that the thread is in the SleepInternal() method, that method was called from the Sleep() method right below it and the Sleep() method was called from the Main() method. Therefore, I would look in the Main() method to see why on earth someone is calling the Sleep().
NOTE: Instead of using WinDbg to analyze the memory dump, you can use Debug Diag as discussed here.
NOTE: If you are running your WebJob as a singleton and you have multiple instances of your Web App, you might login to a KUDU instance which is not running your WebJob…


