Setup:
- Install Debugging Tools for Windows – for WinDbg
- Install and configure CSharpGuitarBugs on an IIS server as described in Lab 1
- Place PROCDUMP executable on the IIS Server
- Review memory dump collection process for W2K8 and W2K12
Lab 21.1
- Open the main page of the CSharpGuitarBugs website so that a W3WP process is instantiated
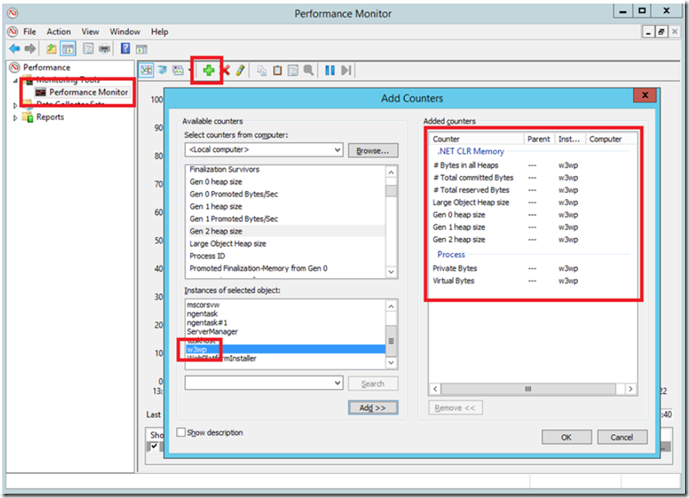
- Open Performance Monitor
Figure 1, Debugging a W3WP process with high memory consumption
- Add the following performance monitor counters for the specific W3WP process running the CSharpGuitarBug web site
.NET CLR Memory\# Bytes in all Heaps
.NET CLR Memory\# Total committed Bytes
.NET CLR Memory\# Total reserved Bytes
.NET CLR Memory\Large Object Heap size
.NET CLR Memory\Gen 0 heap size
.NET CLR Memory\Gen 1 heap size
.NET CLR Memory\Gen 2 heap size
Process\Private Bytes
Process\Virtual Bytes
Figure 2, Debugging a W3WP process with high memory consumption
- Open up 5 browser tabs and navigate to the main page of the CSharpGuitarBugs web site
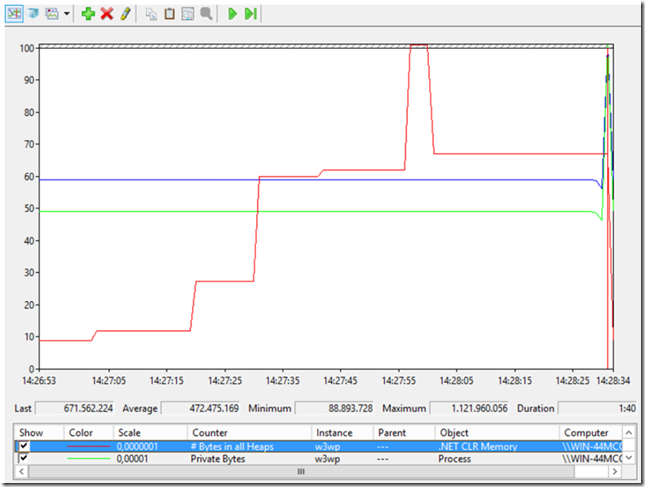
- Perhaps 1 second apart, click on the ‘Rate a Product’ link which will consume lots of memory, you may see something like the following
The below image contains only # Bytes in all Heaps, Private Bytes and Virtual Bytes. Since the Private Bytes and Virtual Bytes remain consistent, it does not appear to be a memory leak, it is just some code that when run is consuming more memory. If the Private and Virtual Bytes follow the same pattern, then it would look like a memory leak. NOTE to Self: write a memory leak lab. If the Private Bytes and # Bytes in all Heaps follow then there may be a Native memory leak.
Figure 3, Debugging a W3WP process with high memory consumption
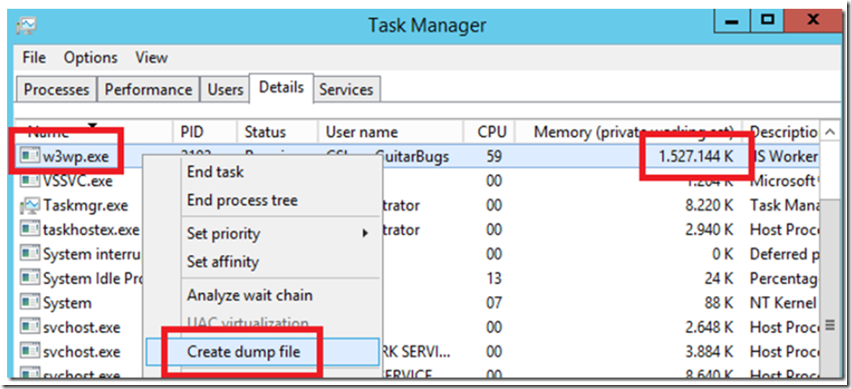
Without already knowing which link you clicked to trigger the memory consumption, this would just look like the W3WP process is consuming too much memory. If you open Task Manager and look at the amount of memory consumed, then you can also confirm that.
Figure 4, Debugging a W3WP process with high memory consumption
In the next lab you will find out how to determine which objects are consuming the memory and trace it back to the method, class and page from which it is triggered.
Lab 21.2
You know now that your web site is having a problem and it consumes too much memory. If you had determined that the memory was leaking and it was managed code, then the process is usually to capture ~3 memory dumps 1-2 minutes apart and then compare them to see where the memory is being leaked. However, if the issues is not a leak and you only want to see what is consuming the memory when the process is larger than expected, you would only need to capture a memory dump while the consumption issue was greater than expected. I wrote about a number of ways to capture a memory dump here, but in this case I think it is safe to use the quick and simple method.
When the W3WP process is consuming too much memory as shown below, right-click the process and select Create dump file. NOTE the process is consuming 1.52GB and will there for create a file of that size on the C:\ drive. If you are short on disk space don’t do it this way, instead use PROCDUMP or some other tool where you can specifically set the location where the file is written.
Figure 5, Debugging a W3WP process with high memory consumption
As the process is running in a 64Bit process and using 4.5 I have copied not only the memory dump to my local machine but the C:\Windows\Microsoft.NET\Framework64\v4.0.30319\SOS.dll file. I may also use MEX which I describe here.
Here is a list of commands you can use for analyzing a memory dump from a memory consumption perspective
| Command | Description |
| !eeheap –gc | Reports the size of the .NET heap |
| !address –summary | A report on what is using which memory |
| !dumpheap –stat | Total heap size, why are the results from !eeheap different? Free objects are not included in !eeheap |
| !dumpdomain | Description of the AppDomain and loaded assemblies/modules |
| !dumpmodule | Dumps the details of the module |
| !dumpheap –mt | Dumps the method table |
| !dumpobject | Dumps to content of that object |
| !gcroot | Maps the object to the thread / class / stack which instantiated it |
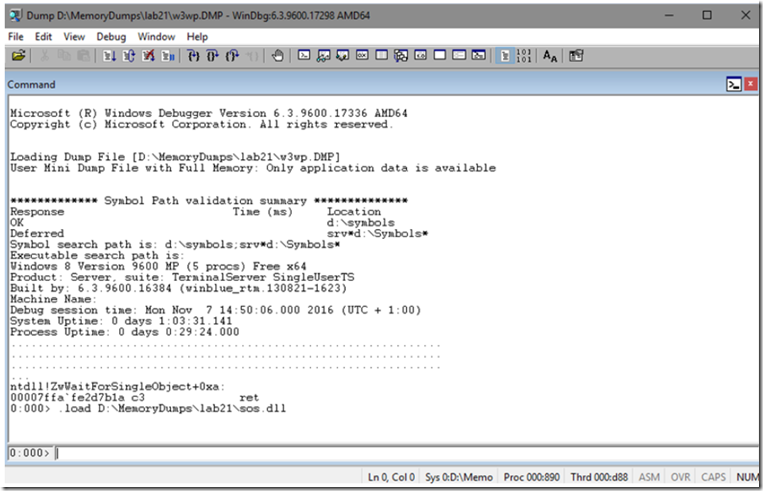
1. Open the memory dump in the 64bit version of WinDbg and load the SOS extension: .load SOS.dll
Figure 6, Debugging a W3WP process with high memory consumption
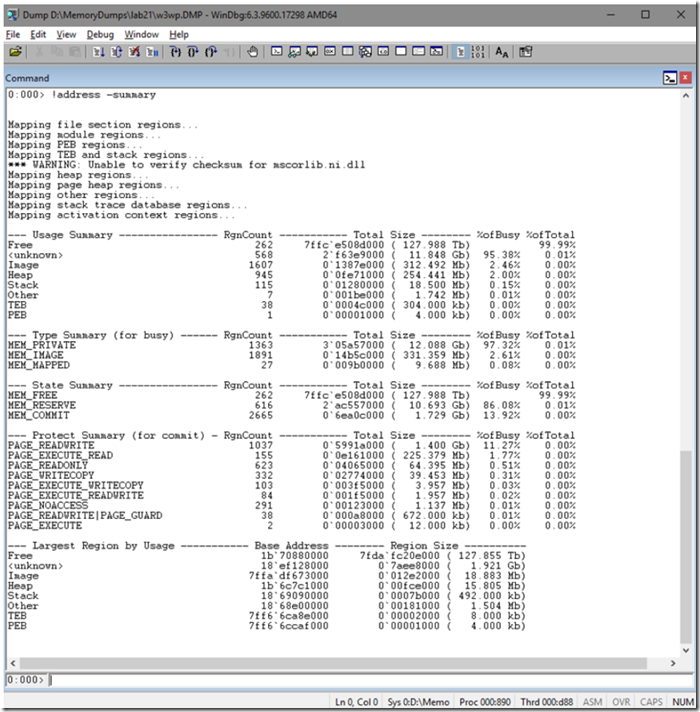
- Run the !address –summary for an overview of the memory usage, you can also run !address –? to get some additional details about the command. Some modified content of the help are listed in the following table, followed by the actual report.
| Attribute | Description |
| Unknown | unclassified regions (‘busy’ regions that could not be classified better) |
| Free | ‘free’ regions (not ‘busy’: neither committed, nor reserved) |
| Image | Loaded DLLs for example |
| Stack | |
| Teb | |
| Peb | |
| Heap | Heaps which are owned by the process |
| MEM_PRIVATE | Reserved + committed bytes, this is not the same as Private Bytes |
| MEM_COMMIT | Very similar to Private Bytes |
| MEM_RESERVE | Very similar to Virtual Bytes |
Figure 7, Debugging a W3WP process with high memory consumption
I look at the bottom of the report and see the ‘Largest Region by Usage’ and I see that there is 1.921GB allocated to which is commonly mapped to managed code.
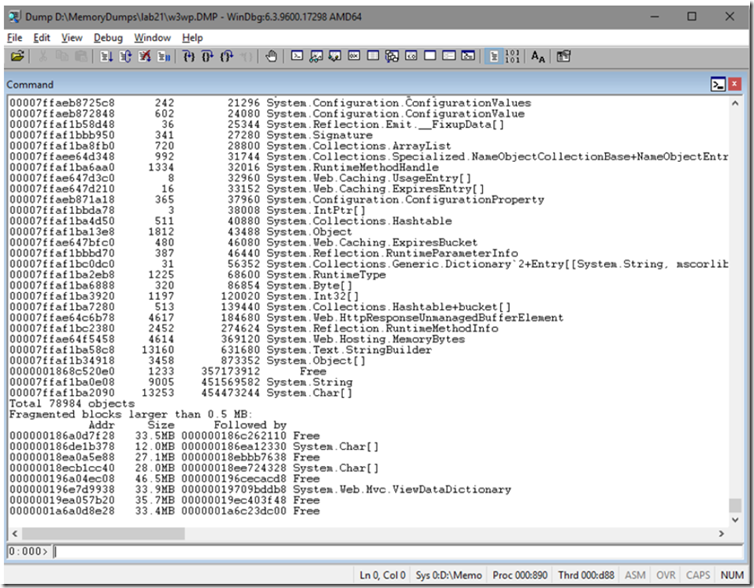
- Execute !dumpheap –stat to get a list of the objects that consume the most amount of memory
Figure 8, Debugging a W3WP process with high memory consumption
From this point it is complicated and time consuming because from now, you just need to look at anything/everything that seems wrong, being able to find what is wrong comes from experience, talking to colleagues and just plan old elbow grease.
It is very obvious that there are a large number of System.String (9005) with a size of 450MB and a 13253 System.Char[] with a size of 454MB. Most of the memory dumps I analyze match this pattern because the most used variable type is generally a String.
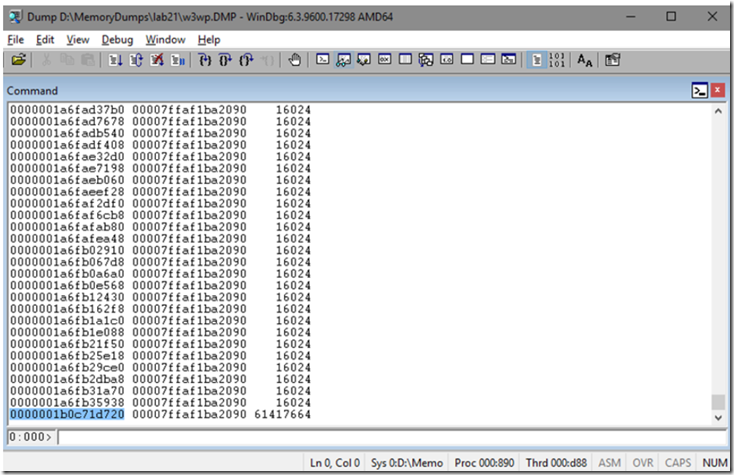
- Dump the Method Table for the System.String and System.Char[] using !dumpheap –mt 00007ffaf1ba0e08 and !dumpheap –mt 00007ffaf1ba2090
Specifically for the System.Char[] I found this, the object dumped at the end of the method table is this one: 0000001b668c0818
Figure 9, Debugging a W3WP process with high memory consumption
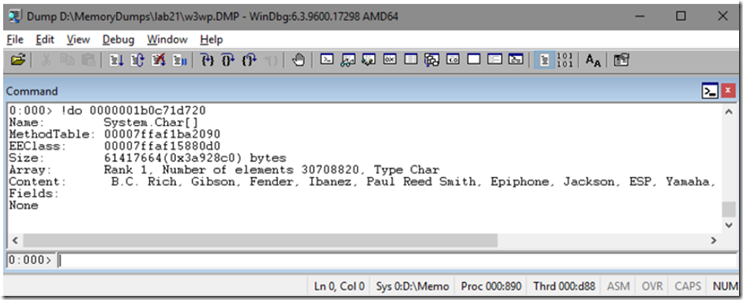
- Dump the specific object using !do 0000001b0c71d720 to find out more details about it
Figure 10, Debugging a W3WP process with high memory consumption
So, we have clue #1, there is a 61MB System.Char[] that has some content of: B.C. Rich, Gibson, Fender, Ibanez, Paul Reed Smith, Epiphone, Jackson, ESP, Yamaha, Taylor, B.C. Rich, Gibson, Fender, Ibanez… and I need to think about my application and where this could be coming from.
- Run the !gcroot 0000001b0c71d720 command to see where the object is instantiated from. You do not always get lucky with this command, but sometimes it leads you right to the source.
Figure 1, Debugging a W3WP process with high memory consumption
In this case I get another clue that perhaps I can look at the Forums –> Rate Product to see what is going on there.
- I noticed that when I dumped the method table for the System.Char[] that there were a large number of object with the size of 16024, I dumped out a few of those and they did not reveal any clues. so I executed this command to only view objects greater the 16024: !dumpheap -mt 00007ffaf1ba2090 -min 16025 which resulted in showing 4 of those objects with the identical size of ~61MB.
Figure 2, Debugging a W3WP process with high memory consumption
I dumped out each of the objects using !do 0000001b5b7f1020, !do 0000001b1d101020, !do 0000001b537f1020 and !do 0000001b0c71d720, all of which had the same pattern and gcroot. The path is getting hot, at this point go look at the code to see what the Rate a Product is doing is determine if you can see why there is so much memory consumption.
- Execute !threads to see which thread is e90 as shown from the gcroot output, see that thread 34 has the OSID of e90
Figure 3, Debugging a W3WP process with high memory consumption
- Change the focus to thread 34 using ~34s and dump the stack using !clrstack, nothing popped out, so it was worth a check

