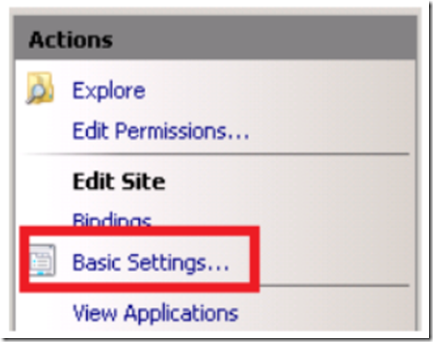
On a web server with multiple application pools, there most likely will be multiple W3WP processes. Therefore, the first action to take when creating a memory dump of a W3WP worker process is to find which W3WP process you need to get the dump of. To do this, open IIS 7 and select the web site which is having the problem, in this example, let’s assume the “Default Web Site”. Then, in the Actions Pane select Basic Settings… as shown in Figure 1.
Figure 1, accessing application pool basic settings
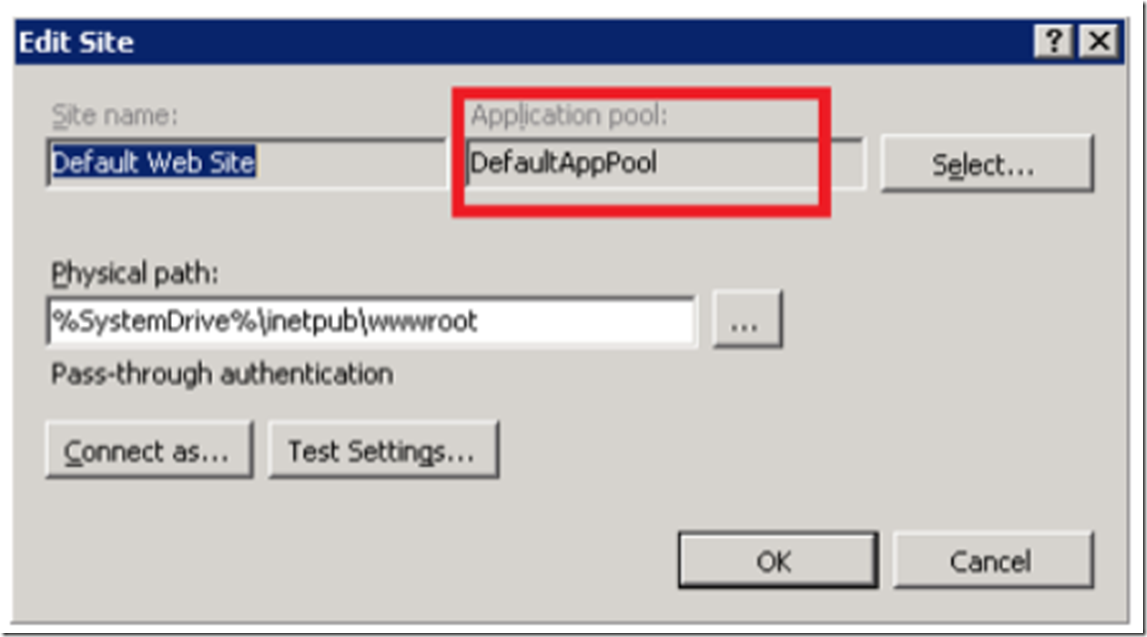
Selecting Basic Settings… will open the window shown in Figure 2, where you will see the name of the Application pool in which this web sites runs. In this case DefaultAppPool.
Figure 2, accessing application pool basic settings
Next, use the APPCMD tool to show a list of all running application pools with associated PID, as shown in Figure 3.
Figure 3, find application pool ID on Windows 2008
On Windows 2008 R2, you can find the application pool and PID within the task manager too, as shown in Figure 4.
Figure 4, Use task manager to find PID of application pool
Once you have the PID of the w3wp.exe worker process, download ProcDump from here, and execute the command line shown in Figure 5.
Figure 5, ProcDump command example
Note: Figure 5 will create a 64bit memory dump. ProcDump currently creates a 32bit dump by default, if your worker process is 64bit you need to add the -64 parameter to capture the dump correctly, simply place -64 before the –ma. If you are experiencing high CPU for example and want to create the memory dump of a process once CPU utilization has exceed 90 percent for 15 seconds, your command would be similar to the following:
C:\>procdump –64 –ma –c 90 –s 15 –o 2028 w3wp-2028-cpu.dmp
If you are experiencing high memory utilization for example and want to create the memory dump of a process once memory utilization exceeds 2GB ,your command would be similar to the following:
C:\>procdump –64 –ma –m 2000 –o 2028 w3wp-2028-memory.dmp
If you are having a performance problem which doesn’t consume a lot of CPU or memory, you can take a number of dumps during the execution of the slow transaction, then analyze the dumps and see what is happening, by comparing the dumps. This will be time consuming, but sometimes, it is an only remaining option. The following example will take 3 dumps 5 seconds apart.
C:\>procdump –64 –ma –s 5 –n 3 2028 w3wp-2028-perf.dmp
Note: There are a large number of parameters which can be passed to ProcDump. Those are discussed in detail on the ProcDump download page.
Once the dump is created you can analyze it using WinDbg and find the reason for the unwanted behavior.
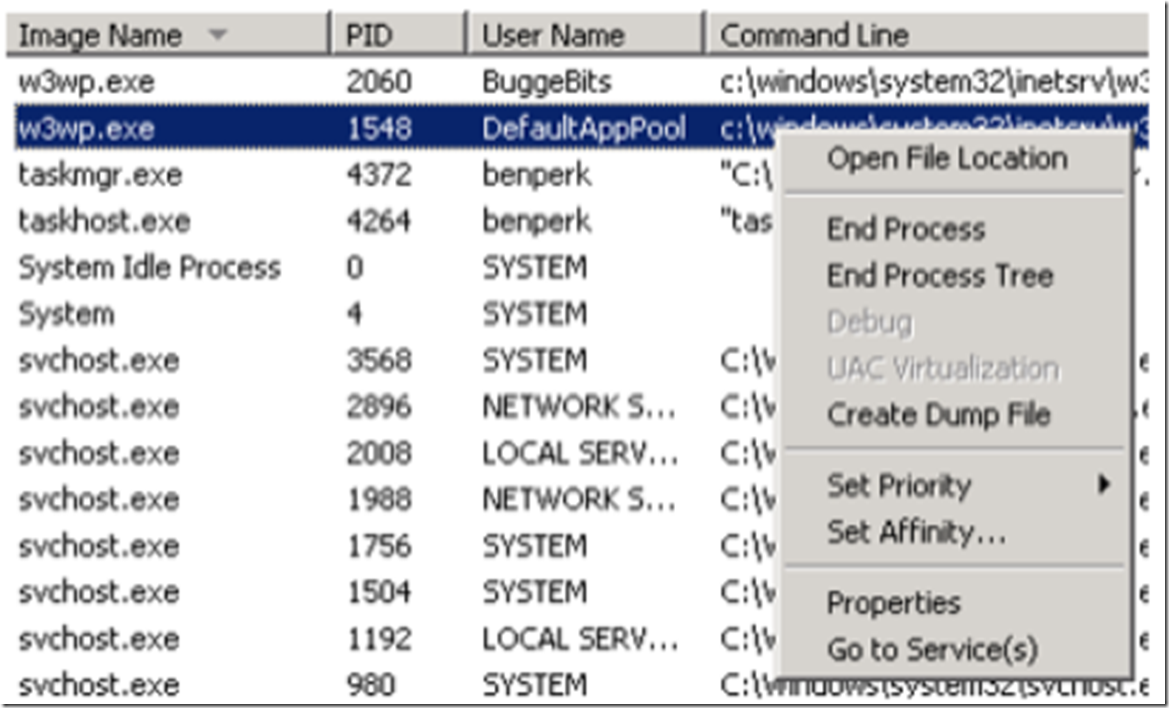
An alternative method to create a memory dump of a W3WP process for a specific web site is to open Task Manager, as shown in Figure 6, right-click on the W3WP process and click Create Dump File.
Figure 6, Task Manager
You would do this, for example, if your W3WP process was consuming 100% of the CPU at the time you created the memory dump. Only use this method if you are certain the issue is happening at the time you select Create Dump File. The benefits of ProcDump is that you can configure it to create the memory dump based on many situations and are therefore more likely to capture a memory dump at the time the issue happens.


