I wrote this article, see the bottom where I do the memory dump analysis and wanted to expand on it some.
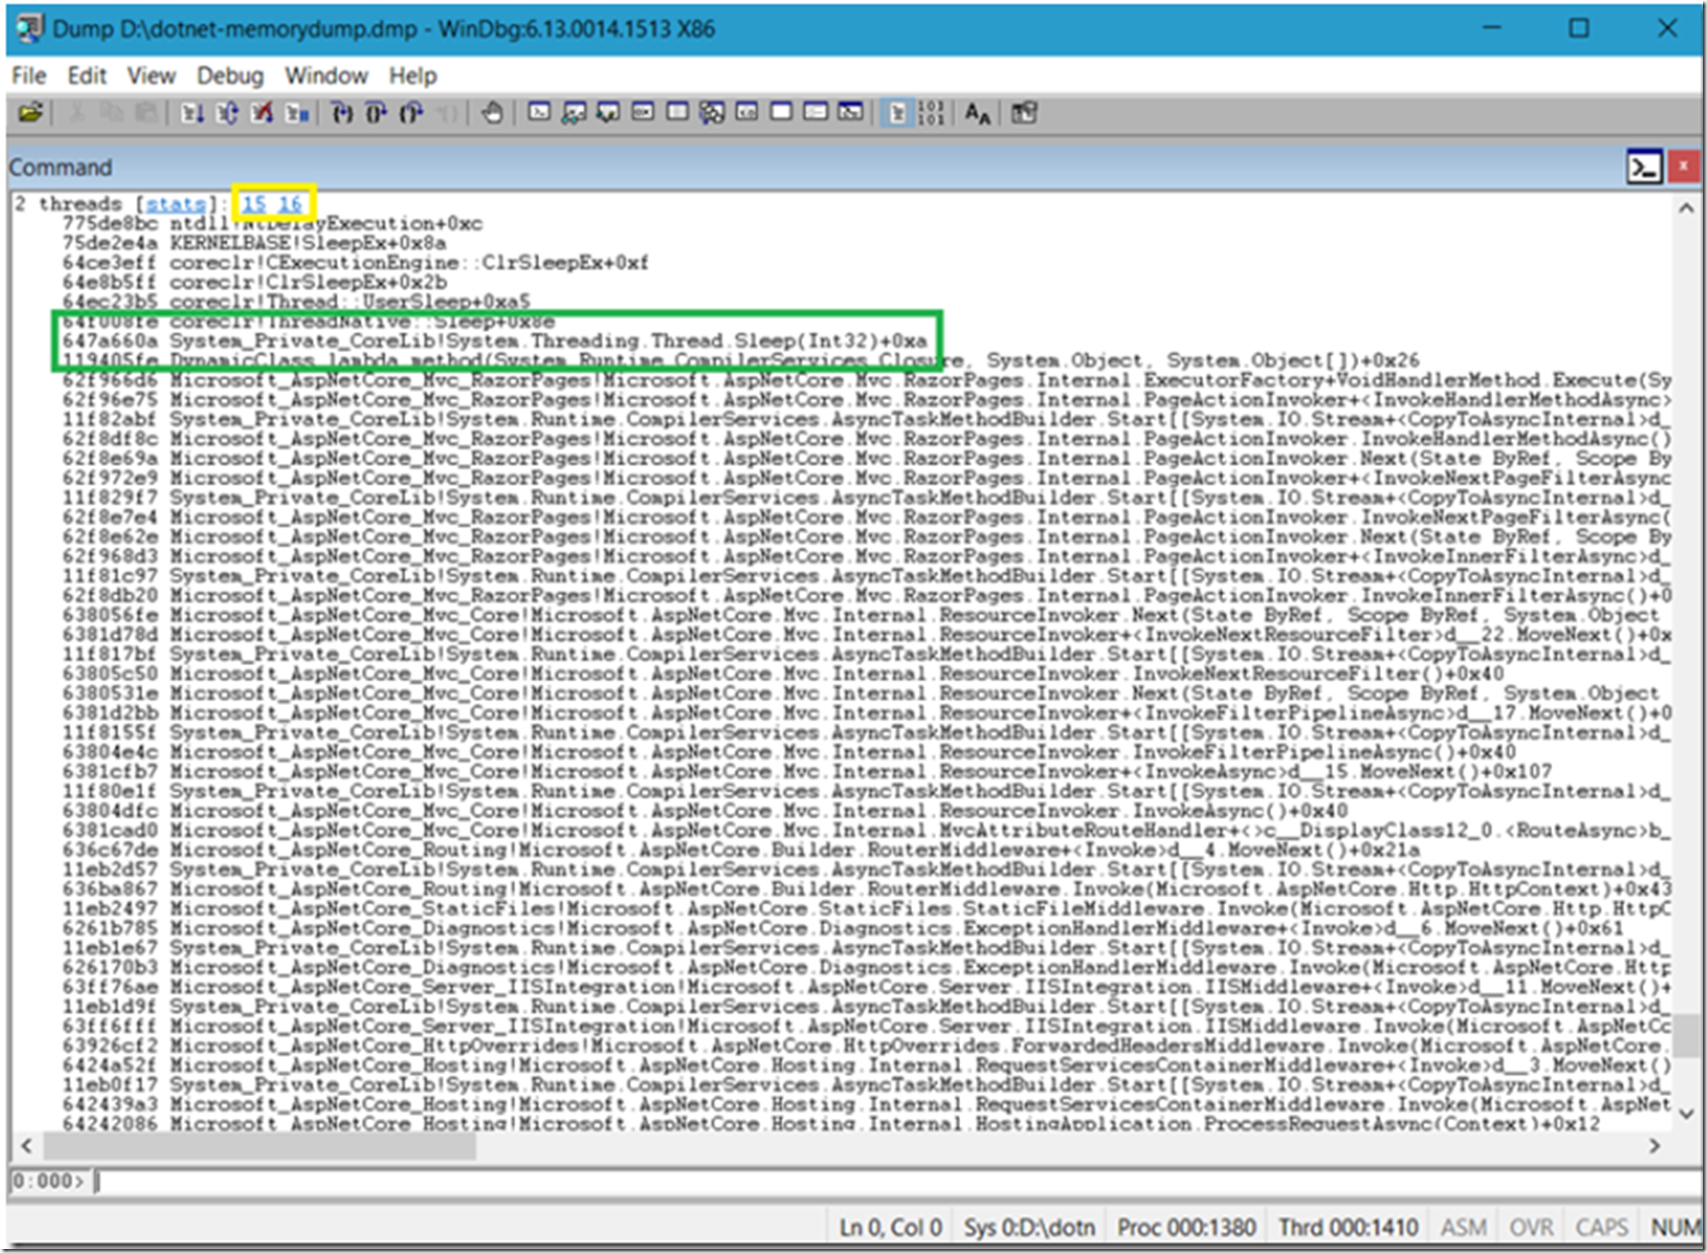
Simply, if you are running managed code then you can decompile the source and see what the value of the Int32 passed to the Sleep() method, Figure 1. I explained how to save the modules with the !sos.savemodule here and here.
Figure 1, how to find the parameter value of a method in WinDbg
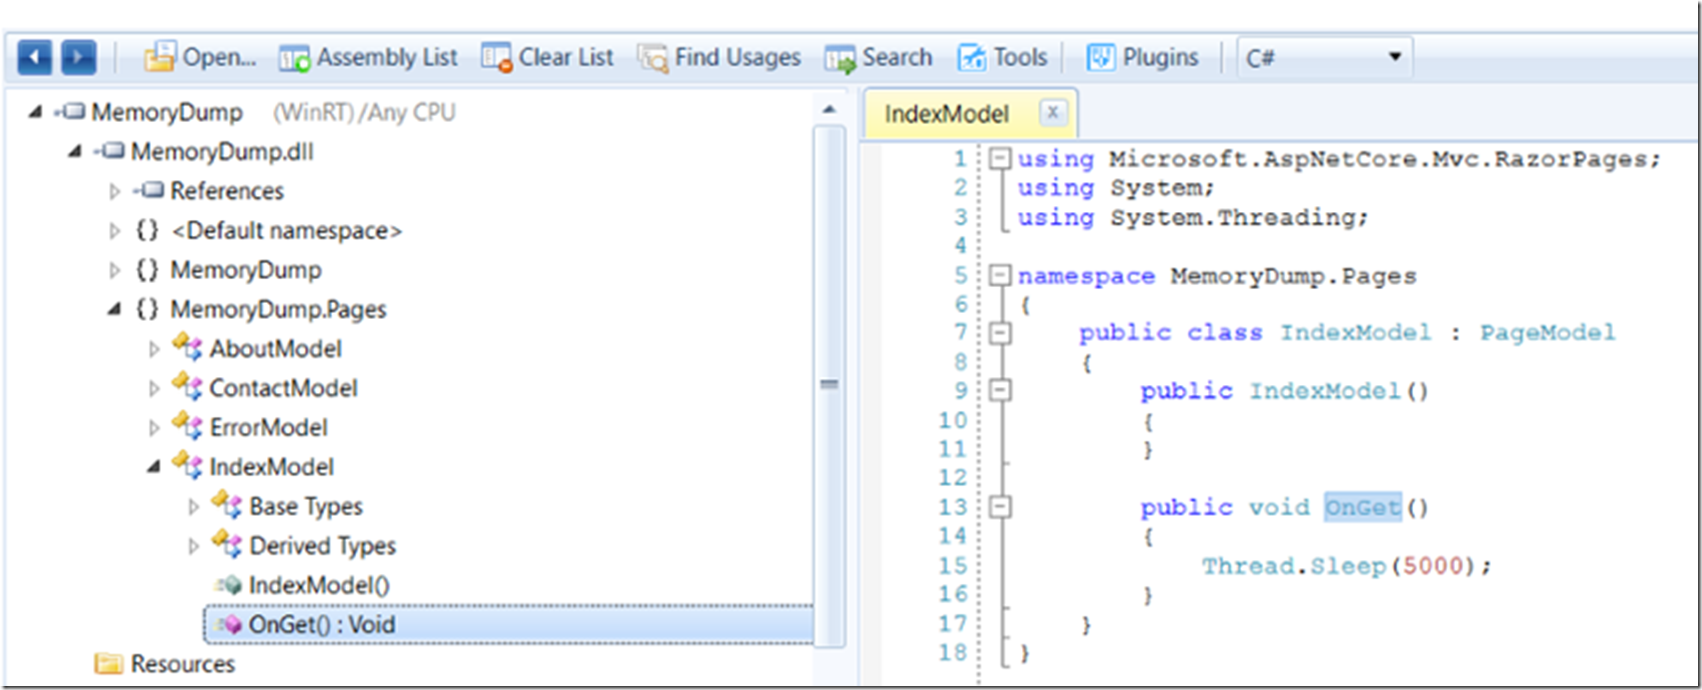
I executed “ !mex.writemodule -a -p d:\dotnetMods” which wrote all the module to my d:\dotnetMods directory. I opened up the the modules in JustDecompile, Figure 2, where I could see my bad code.
Figure 2, how to find the parameter value of a method in WinDbg
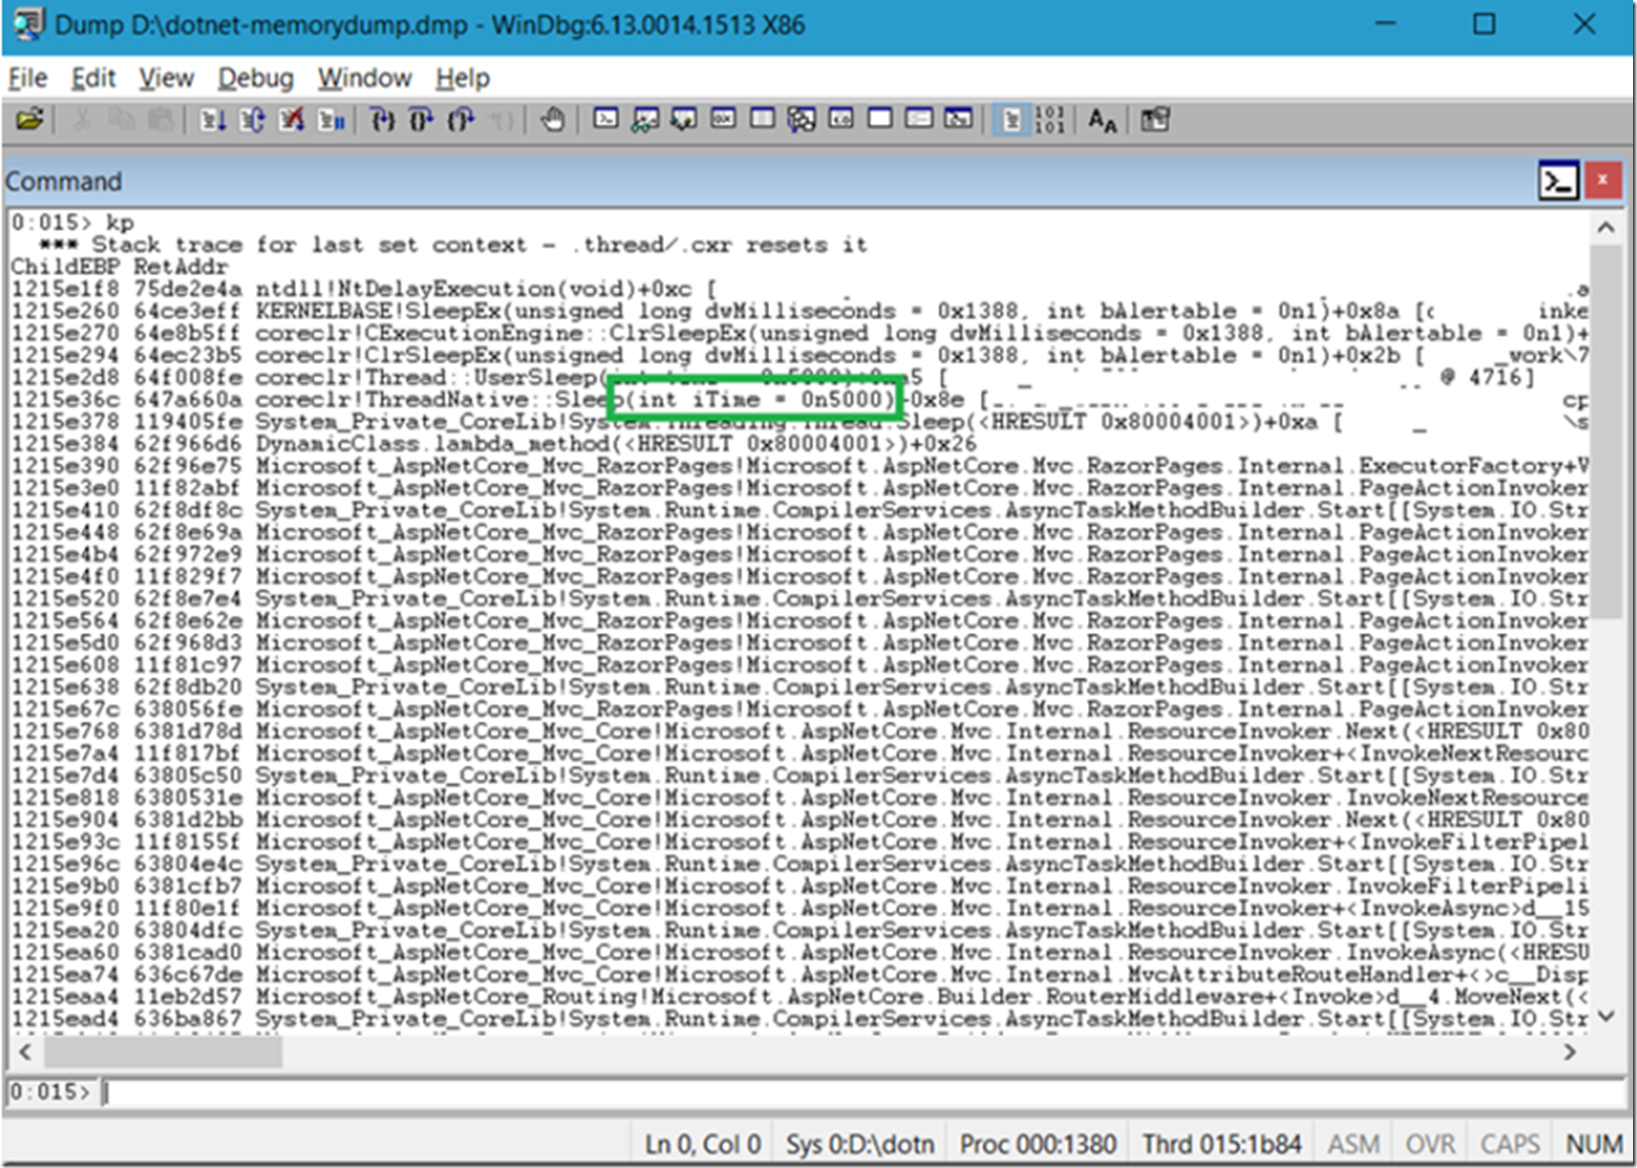
The above does take some time, so you can also execute kp / kP to view the stack frame, Figure 3 and the parameters data type, name and value.
- The k * commands display the stack frame of the given thread, together with related information..
- p Displays all of the parameters for each function that is called in the stack trace. The parameter list includes each parameter’s data type, name, and value. The p option is case sensitive. This parameter requires full symbol information. I am not sure if this means private symbols or not…sorry
- P Displays all of the parameters for each function that is called in the stack trace, like the p parameter. However, for P, the function parameters are printed on a second line of the display, instead of on the same line as the rest of the data.
Figure 3, how to find the parameter value of a method in WinDbg
You can also try real-time debugging which I touch on here instead of post-mortem which is what you do when you analyze a memory dump taken in the past.


