I wrote an article here about how to capture a memory dump of the W3WP process that runs your Azure Web App. Once you get the Memory dump, here are the steps you need to find out what the reason for the slow performance is.
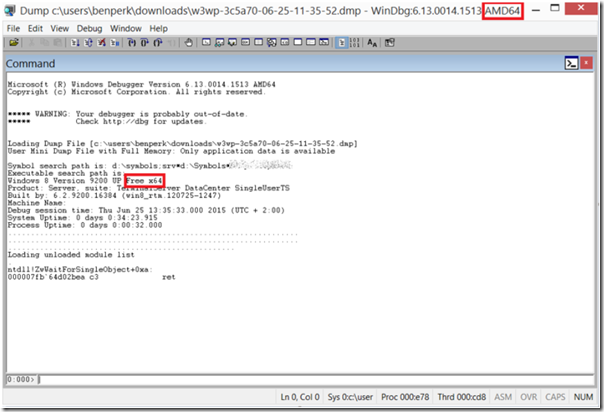
First, I open the W3WP dump in WinDbg, as shown in Figure 1.
Figure 1, open a dump file in WinDbg
Notice in Figure 1 that the WinDbg version is AMD64 and the W3WP process is x64. This is important. If your W3WP process is running in 32bit mode, then you need to open the dump in the 32bit version of WinDbg.
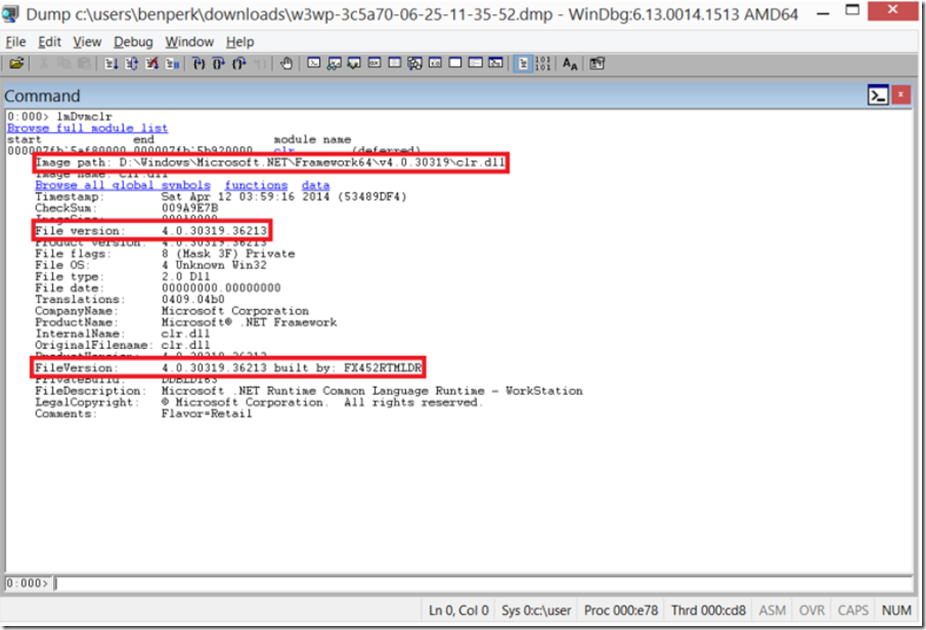
I know that I am running .NET 4.5, but want to check the actual version, so I execute command lmDvmclr command to get the details of the module. The output of that command is shown in Figure 2.
Figure 2, determining the .NET version in which my W3WP process is running
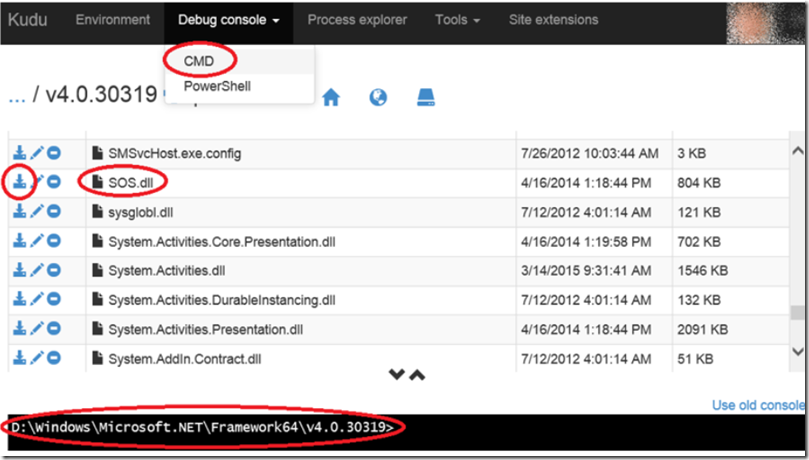
The output shows the location of the clr.dll, which is in the D:\Windows\Microsoft.NET\Framework64\v4.0.30319\ directory, the specific file version of 4.0.30319.36213 and that it is actually .NET version 4.5.2. The version of the CLR is important because you need the SOS.dll which is a managed code extension library used for analysis of the memory dump. If you happen to have the same version on your client machine, super, use the SOS.dll in the C:\Windows\Microsoft.NET\Framework64\v4.0.30319\, otherwise, you can download it from your Web App VM via KUDU. Simply navigate to the D:\Windows\Microsoft.NET\Framework64\v4.0.30319\ and download the SOS.dll file, place it into the same directory as the DMP file you are analyzing. Figure 3 shows how to download the file.
Figure 3, getting the SOS.dll for debugging the Azure Web App memory dump
Once you have the SOS.dll in the same directory as the memory dump, execute .load <drive:\>Directory\SOS.dll in WinDbg and the extension is loaded and ready for use. You can enter !sos.help to get a list of commands.
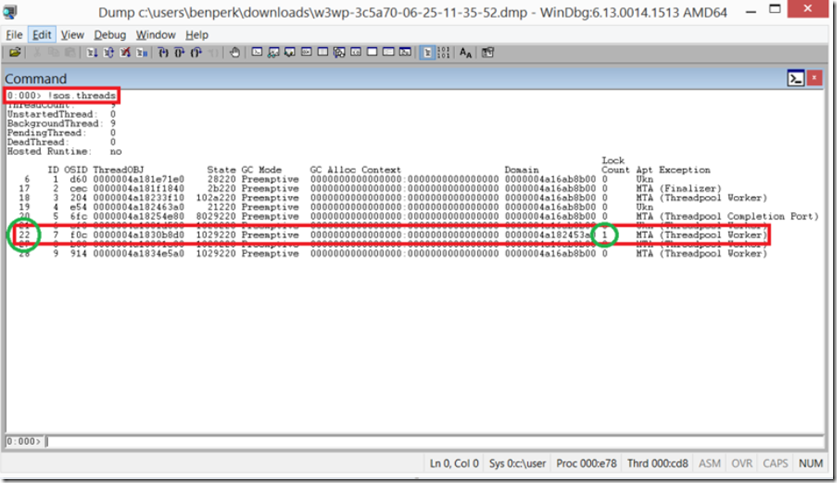
What I am interested in is finding the thread that was running my request which was slow or hung. So I enter command !sos.threads and look at the output. The output is show via Figure 4.
Figure 4, find the thread running my Azure Web App ASP.NET long request
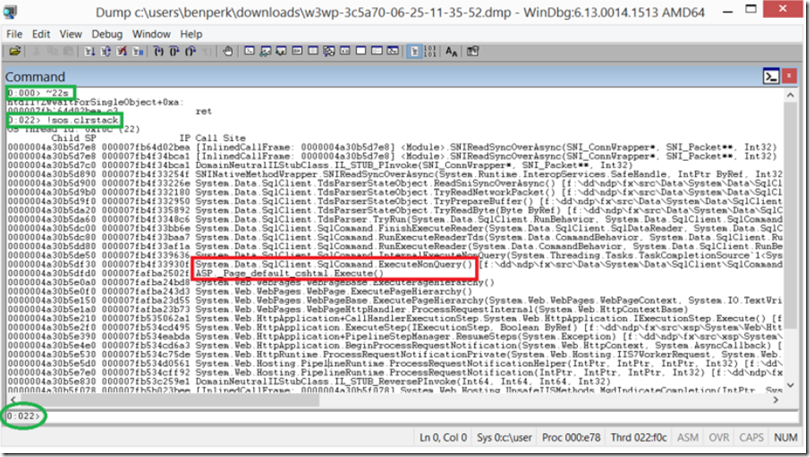
Looking at Figure 4, I see that thread 22 appears to be the only active thread, so I change the debuggers focus to thread 22 by entering ~22s. Then I look at the stack on that thread by entering !sos.clrstack, as shown in Figure 5.
Figure 5, finding the thread and stack of the slow performing ASP.NET request
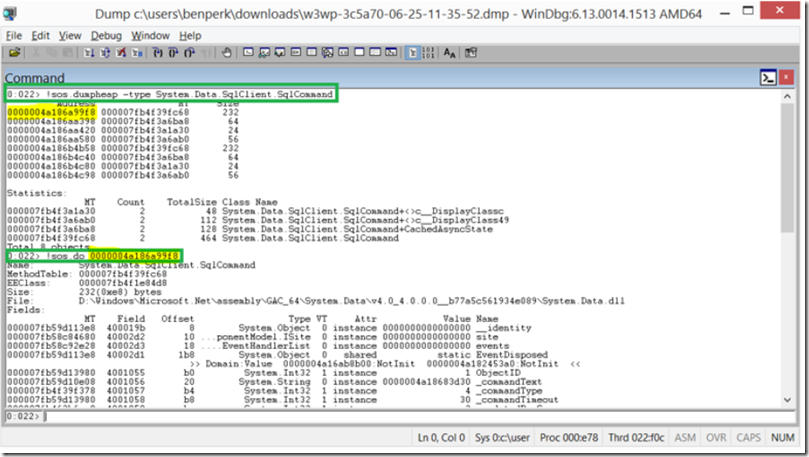
I see some ADO.NET classes and methods on the stack and want to look into them a little more. What I want to do specifically is find the attributes of the System.Data.SqlClient.SqlCommand, I see it is being called from within a default.cshtml file as well, so I know I have the right thread and stack. One note is that I do not see, for example System.Data.SqlClient.SqlConnection.GetConnection() method, that means that the issue is not with getting the connection to the database nor, IMO is the connection to the database the reason for the slowness. However, if you do see this method, there may be some issue with the connection… Nonetheless, I then execute !sos.dumpheap -type System.Data.SqlClient.SqlCommand to list all those objects in this stack, on this thread (22). Then I can dump the contents of the specific System.Data.SqlClient.SqlCommand object by executing !sos.do <address> , as shown in Figure 6.
Figure 6, why is my request taking so long, Azure Web App, ASP.NET
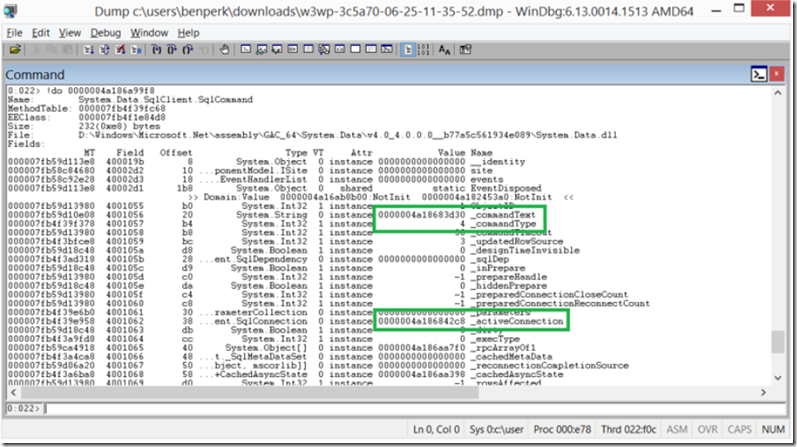
The output of the !sos.do 0000004a186a99f8 displays the attributes of that object. The ones I am interested in are, as shown in Figure 7.
- _commandType
- _commandText
- _activeConnection
Figure 7, analyzing the System.Data.SqlClient.SqlCommand in an Azure Web App memory dump
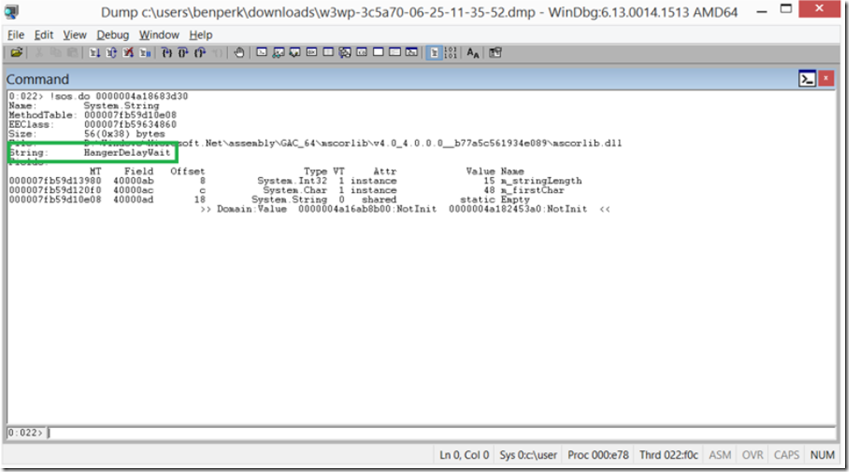
You can see what the value of _commandType is, which is 4, that means it’s a Stored Procedure. Then to find the name of the stored procedure, enter !sos.do 0000004a18683d30, where 0000004a18683d30 is the Value of the _commandText property. The results are shown in Figure 8.
Figure 8, value of the _commandText property, Azure Web App is slow
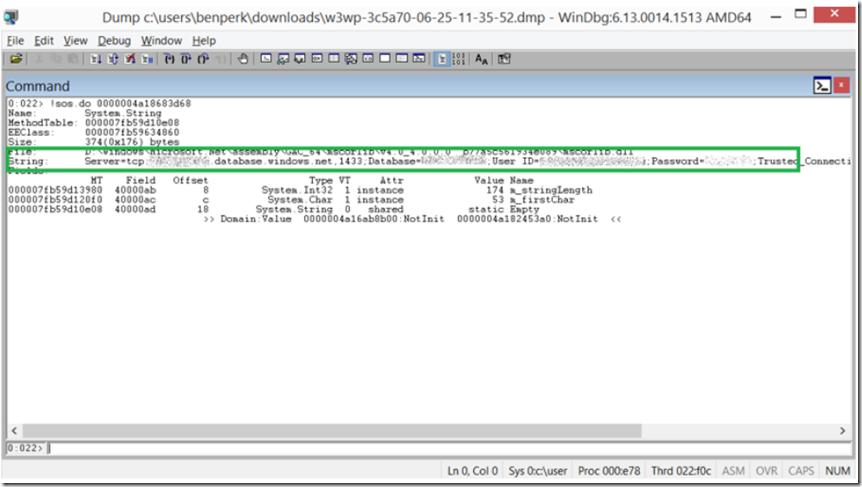
Now I know that my default.cshtml file is executing a stored procedure named HangerDelayWait. I can login to the database and review the stored procedure to find out where the slow code is running or what exactly it is doing that requires so much time. Just to be certain of the specific database the System.Data.SqlClient.SqlCommand is being run on, execute !sos.do 0000004a186842c8, where 0000004a186842c8 is the Value of the _activeConnection property. Alternatively, you can execute !sos.dso and scroll through the output until you find a System.String that resembles a ConnectionString. The _activeConnection contains a Name and Value combination for the System.Data.SqlClient.SqlConnection _connectionString property. Execute !sos.do 0000004a18683d68 where 0000004a18683d68 is the Value for the _connectionString property, as shown in Figure 9.
Figure 9, how to get the System.Data.SqlClient.SqlConnection connection string from a memory dump
There you have it, you the name of the request file on your Web App, the method the file is calling, you know that the code has made a connection to the database, you know the type of command, the name of the stored procedure and the database name, uid and password. Now you can look into why the stored procedure is so slow.
