If you have not tried creating a Self-Hosted Web API, you might give it a shot, here is a good, getting started example. Once it gets into production, if you are looking for ways to troubleshoot a slow performing self-hosted Web API, searching for a W3WP process to take a memory dump of or applying normal IIS troubleshooting techniques will not apply here. This is because the self-hosted Web API runs within the context of its own EXE and not within the W3WP process.
UPDATE 6-JUN-2016, check here for some exception handling tips.
The way I did some troubleshooting was by using Debug Diagnostics 2.0, which you can download here.
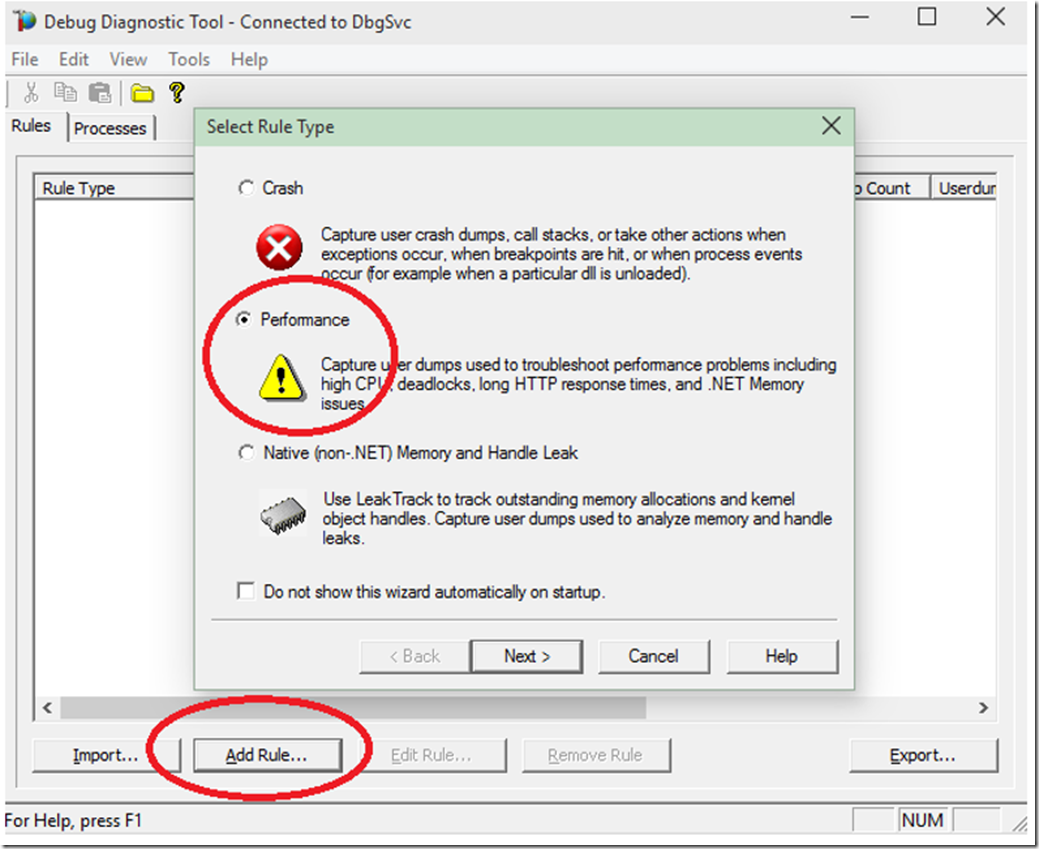
Once downloaded and installed on the web server that contains the Web API, follow these instructions to capture a memory dump and see which method is being hung. Open the debug diagnostic tool and select the Add Rule… button, then click on the Performance radio button, then Next as shown in Figure 1.
Figure 1, get a memory dump of a self hosted Web API
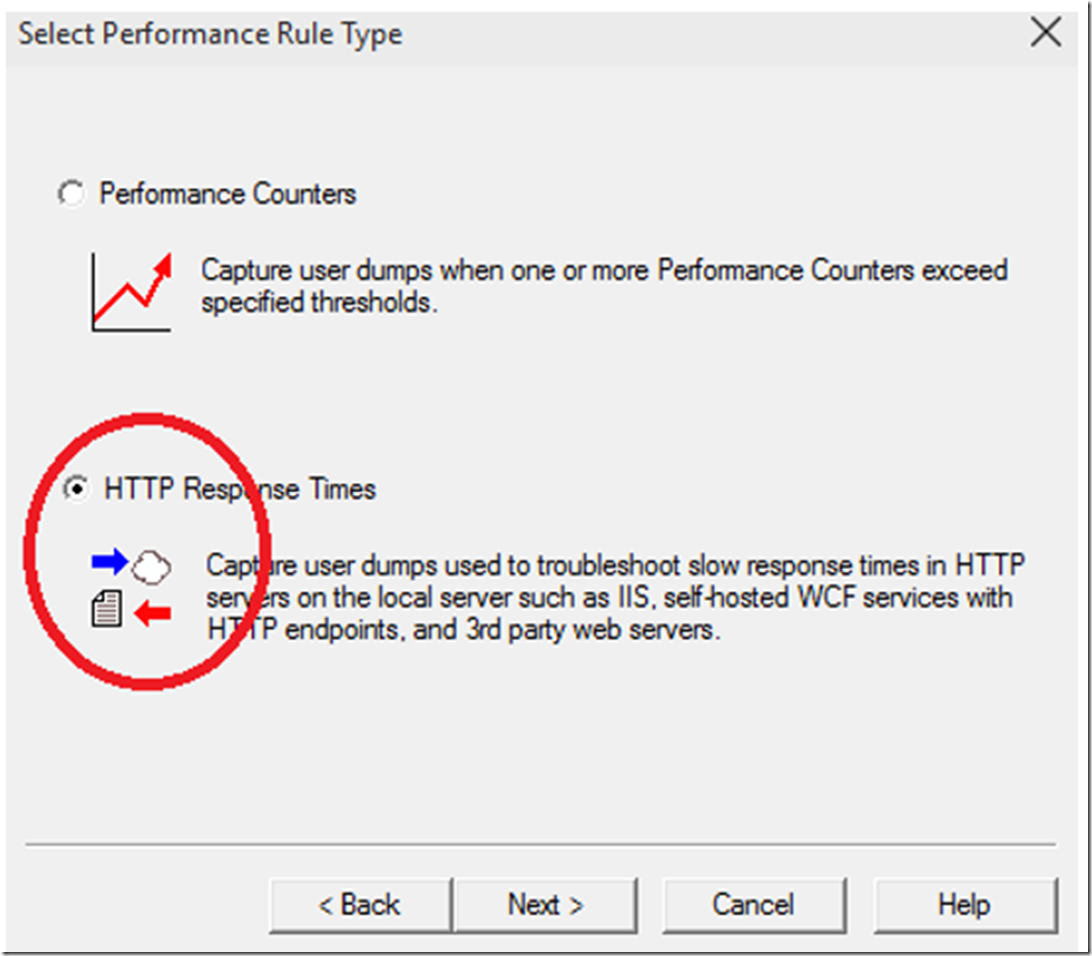
As shown in Figure 2, select on the HTTP Response Times radio button, then Next.
Figure 2, set the rule to capture the self-hosted Web API
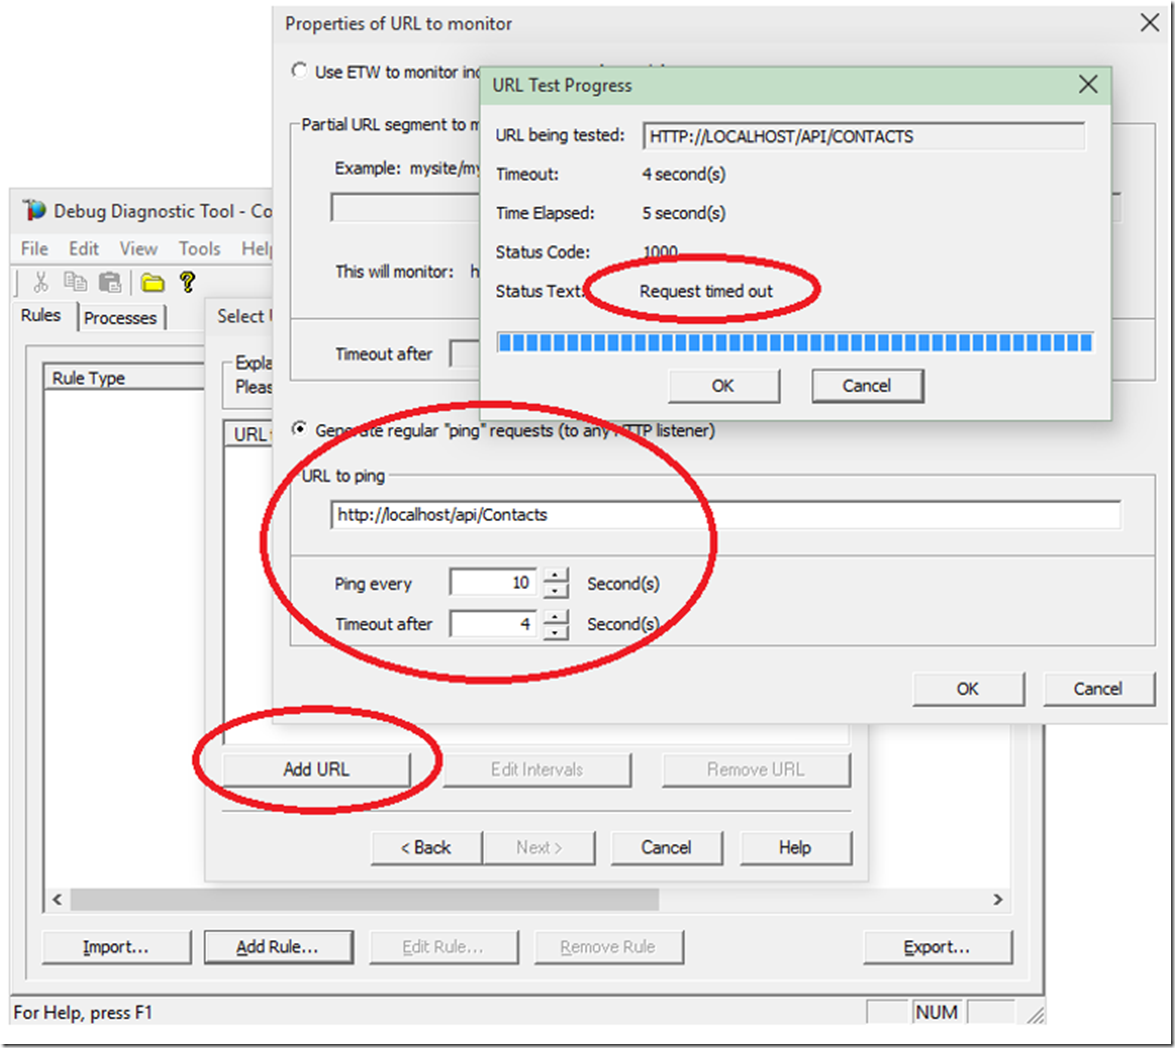
A window with the title “Select URLs to monitor” is then rendered. Click on the Add URL button and then the “Generate regular ‘ping’ requests…” radio button. The URL to my slow running Web API is shown in the “URL to ping” text box. As shown in Figure 3, I have set the ping to happen every 10 seconds and if the request takes longer than 4 seconds, I expect a memory dump to be taken of the self-hosted Web API. As this is a test, I really already know why my self-hosted Web API is slow and that it will take at least 5 seconds to complete, but for this example, let’s pretend I do not.
Anyway, I do the test and it does time out, maybe it would time out randomly in real live situations, and then you would get a memory dump, things work simpler when testing. Click the OK button, then click Next.
Figure 3, setup Debug Diag for self-hosted Web API
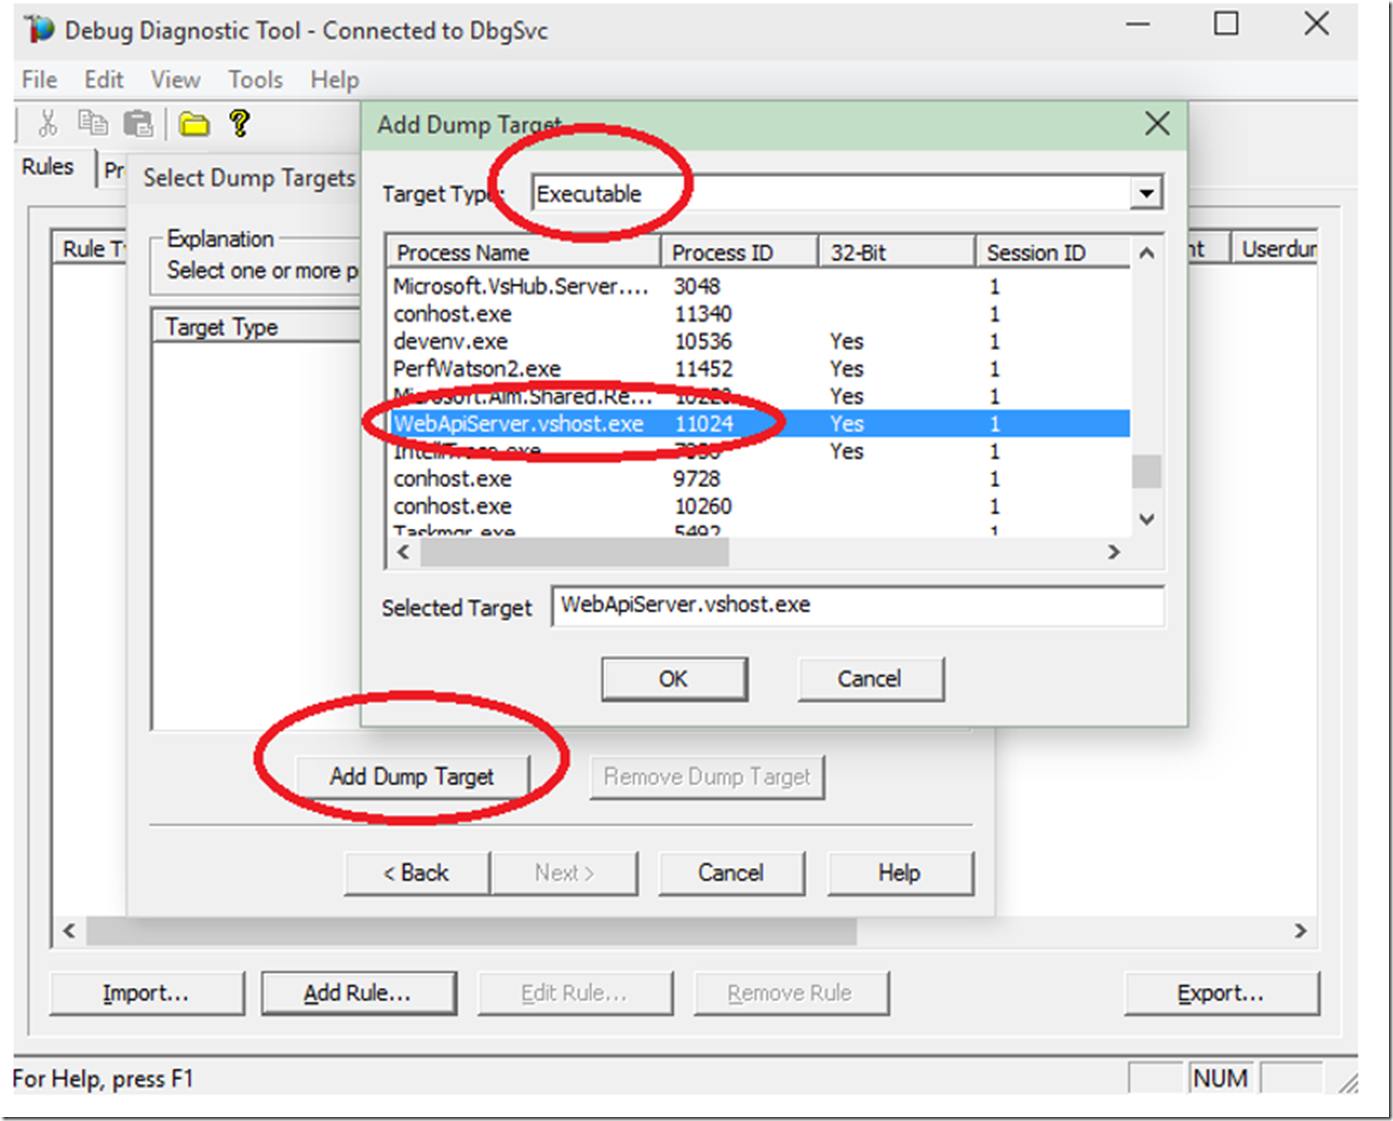
The next configuration is to select the dump target, as shown in Figure 4, select the Add Dump Target button the Executable from the drop-down. The self-hosted Web API is running with Visual Studio and is called WebApiServer.vhost.exe. You select the EXE which is performing slow for you and then select OK.
Figure 4, select the EXE which is running the self-hosted Web API
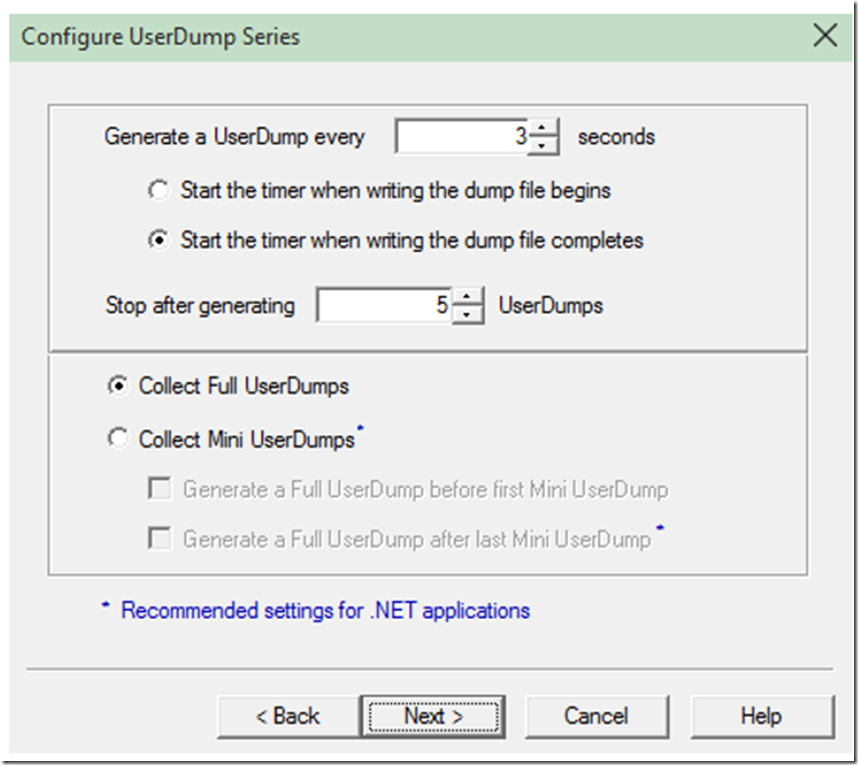
Next, select your preferences in the Configure UserDump Series. As shown in Figure 5, I select to generate a dump every 3 seconds, to stop generating after 5 dumps and to Collect Full User Dumps. IMO, we need Full User Dumps to do the analysis in depth, to this is the only setting which I have any real comment about.
Figure 5, collect full memory dumps of a self-hosted Web API
Select the next button, and complete the wizard by giving the rule a name and defining the local where the dumps are to be written.
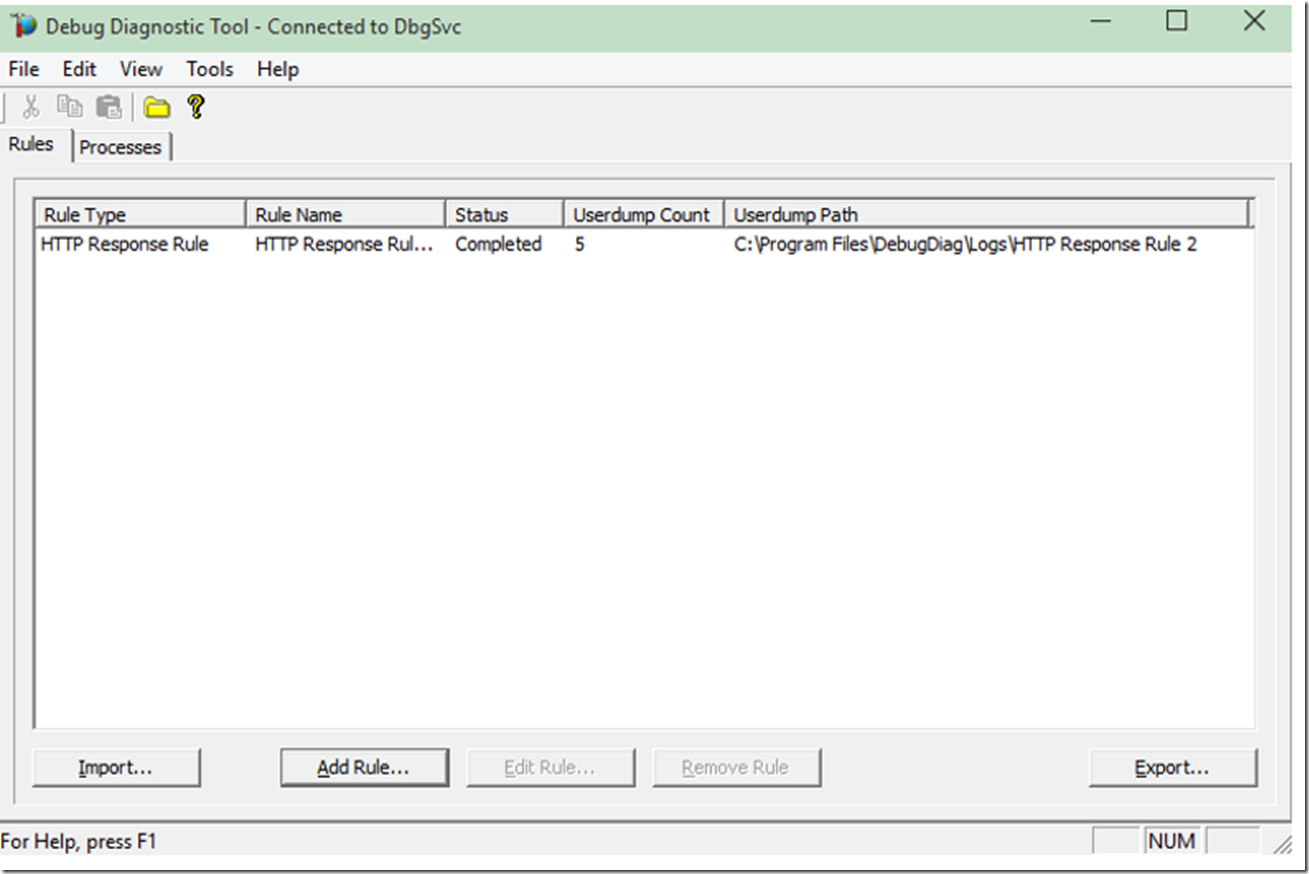
I know that my self-hosted Web API is runs over the limit in which I configured, so based on my settings in Figure 5, I would expect 5 memory dumps. As shown in Figure 6, it does indeed generate 5 memory dumps.
NOTE: It is expected that if the PING timeout that whatever is causing the self-hosted Web API EXE to not respond is the code which is currently running.
Figure 6, collected memory dumps of self-hosted Web API
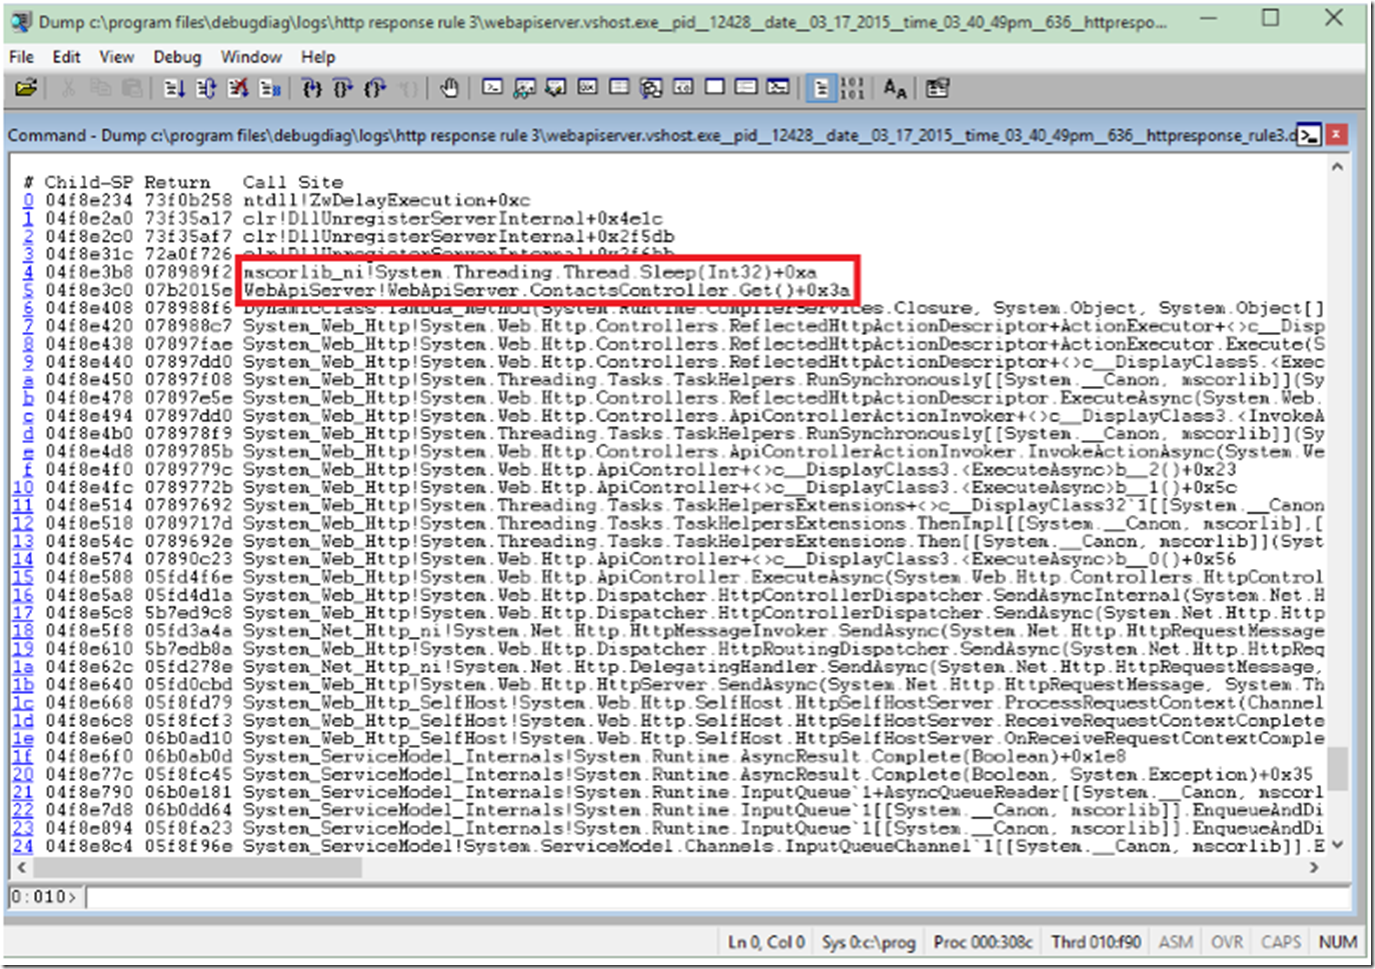
I open one of the memory dumps in WinDBG and check out the threads and stacks, as illustrated in Figure 7. I looked at all the threads that were active in that process and found that on thread 10 there was a call to my ContactsController.Get() method which contains a call to the Sleep() for 5 seconds.
Figure 7, why is my self-hosted Web API slow
This is a test case, but in a majority of cases, you can look at the top method(s) on a stack and they are generally the ones causing the slow performance.
