One of my favorite tools for troubleshooting Internet Information Service issues is ProcDump. It is a single, small, yet powerful EXE that is very useful for capturing W3WP.exe process memory dumps. One of my other favorites is Failed Request Tracing which I have written about here and here for a Windows Azure Web Site. Failed Request Tracing is a great place to find where the time is being spent during the processing of a request. I like to use this one first to see if the issue is obvious because it is quick and easy to install and configure. Only if the issue cannot be found at this level, do I proceed to capturing a memory dump of the W3WP.exe process. Doing the latter takes more time and effort, always be on the lookout for areas where effort can be reduced right?
One of the challenges that falls right in between the two tools is the ability to capture a memory dump when a request is taking a long time. And the request taking the time happens randomly, appears to have no trend or symptom that you can configure Procdump to act on. If the request always takes a long amount of time, then it is pretty easy, just take 3-4 memory dumps 3-4 seconds apart and see where the threads and stacks are stuck. This ProcDump statement captures 3 memory dumps 4 seconds apart, where PID is the Process ID of the W3WP.exe process.
C:>procdump –64 –ma –s 4 –n 3 PID w3wp-PID-perf.dmp
NOTE: You can configure a tool like Debug Diagnostics to capture memory dumps on many events, check it out too and see if there are some custom rules you can write.
However, if there is no CPU utilization, memory consumption, exception for which a trigger can be placed on, then you really need some luck to catch the long running request. Not any more, now you can configure Failed Request Tracing to capture a memory dump when a request takes too long. After you have installed and configured Failed Request Tracing as illustrated here, you can add a rule to execute a memory dump when the time taken exceeds a configured threshold.
To configure Failed Request Tracing to capture a memory dump based on Time Taken, first confirm you have installed the Failed Request Tracing role, as per these instructions and second, configure a rule at the server level, similar to that shown in Figure 1.
Figure 1, A Failed Request Tracing rule based on time taken
You can alternatively configure the Failed Request Tracing rule to trigger upon an occurrence of a specific HTTP status code, as illustrated by Figure 2.
Figure 2, A Failed Request Tracing rule based on status code
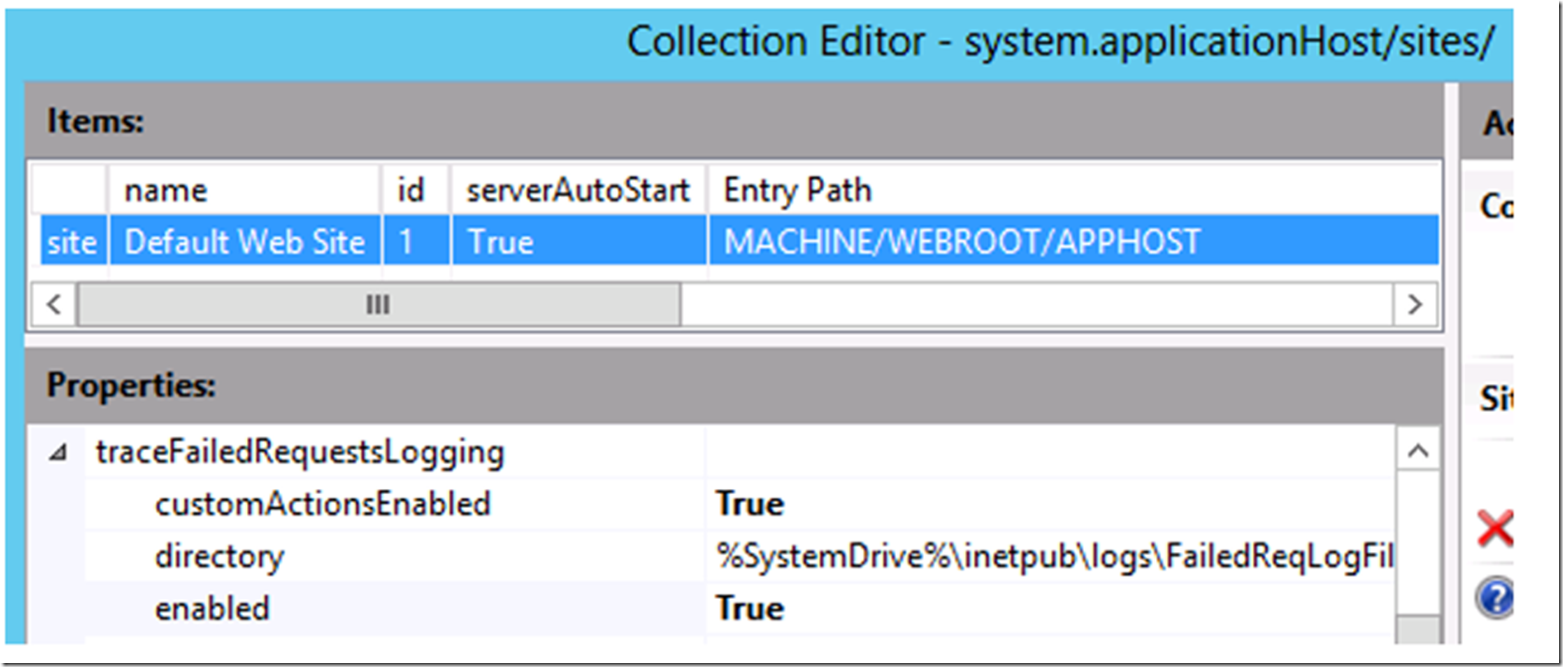
Once Tracing is installed and a rule configured open the Configuration Manager at the server level as shown in Figure 3 and set customActionsEnabled and enabled to true, after clicking on the … button, as shown in Figure 3.
Figure 3, sing Configuration Editor
Figure 4, he enable custom actions using Configuration Editor
Close the pop-up window, Figure 4 and then click the Apply link on the Action pane to apply the changes to the configuration.
Next, download and copy the ProcDump executable to the c:\windows\system32 directory. Create a directory called c:\dump to store the memory dump.
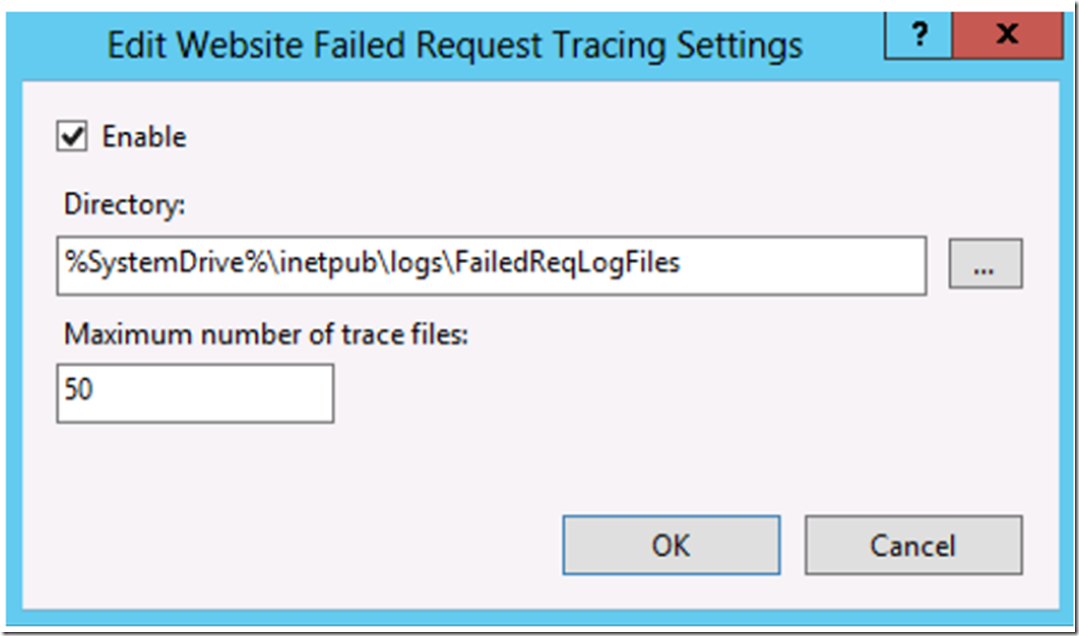
Next, enable Failed Request Tracing for the web site by clicking on the web site and then the Failed Request Tracing… link in the Actions pane. Click the Enable check box, as shown in Figure 5, so that the rule is running for the web site.
Figure 5, enable Failed Request Tracing for a web site
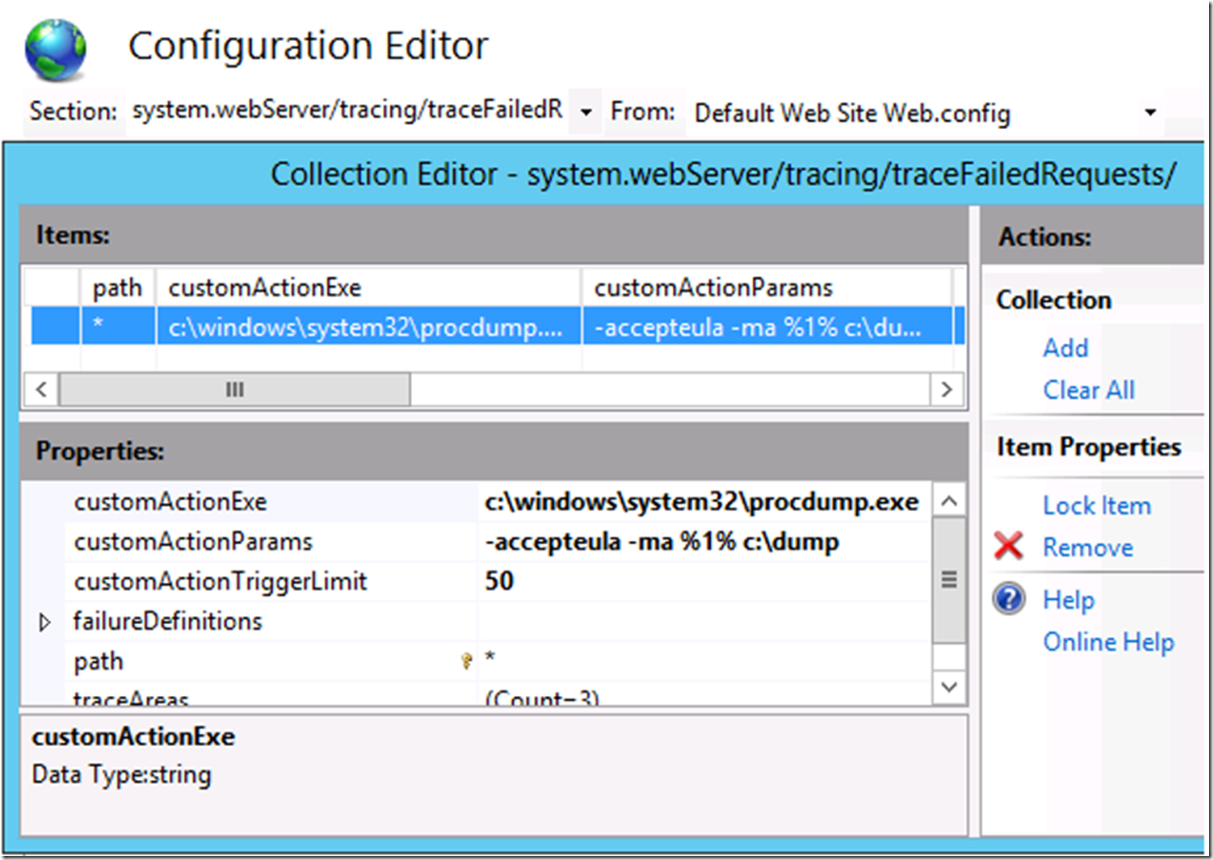
Next, click on the web site where you want to create the memory dump on and click the Configuration Editor and navigate to the <system.webServer> path and click the … button which open the pop up window as illustrated in Figure 6.
Figure 6, Configure Failed Request Tracing custom action executable and parameters
The parameters are as follows:
- customActionExe: c:\windows\system32\procdump.exe
- customActionParams: -accepteula –ma %1% c:\dump
- customActionTriggerLimit: 50
- path: *
Close the pop-up window and click the Apply link on the Action pane to apply the configuration changes. That’s all, now you can let your application run and when a request runs longer than the configured time taken or the request returns a specific HTTP status code, a memory dump of the W3WP process is taken and stored in the c:\dump directory.
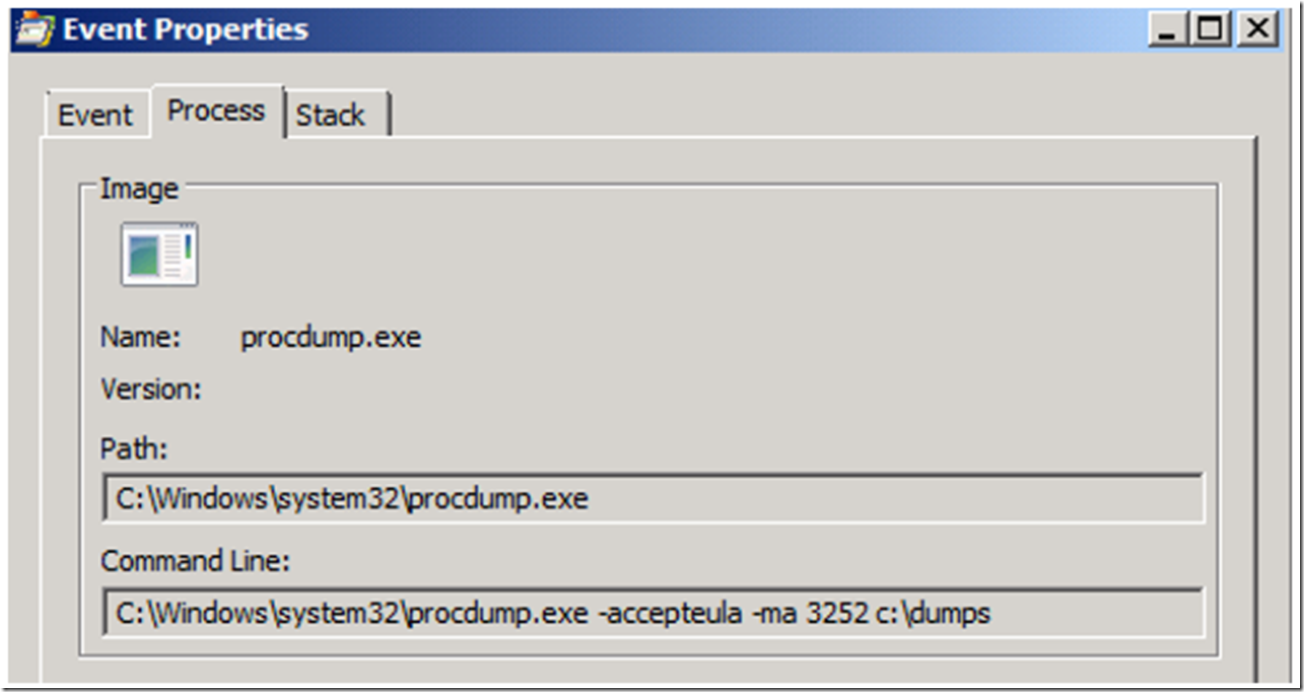
Notice in the following 2 figures, Figure 7 (Task Manager) and 8 (Process Monitor) that the PID of the process is replaced with the %1% parameter in the configuration.
Figure 7, Task Manager showing PID of W3WP worker process
Figure 8, Process Monitor showing the command execution containing the PID
You can take the W3WP memory dump and analyze it using any analysis tool, for example WinDbg or Visual Studio.
There is also a nice blog written about doing the same using ADPLUS here.


