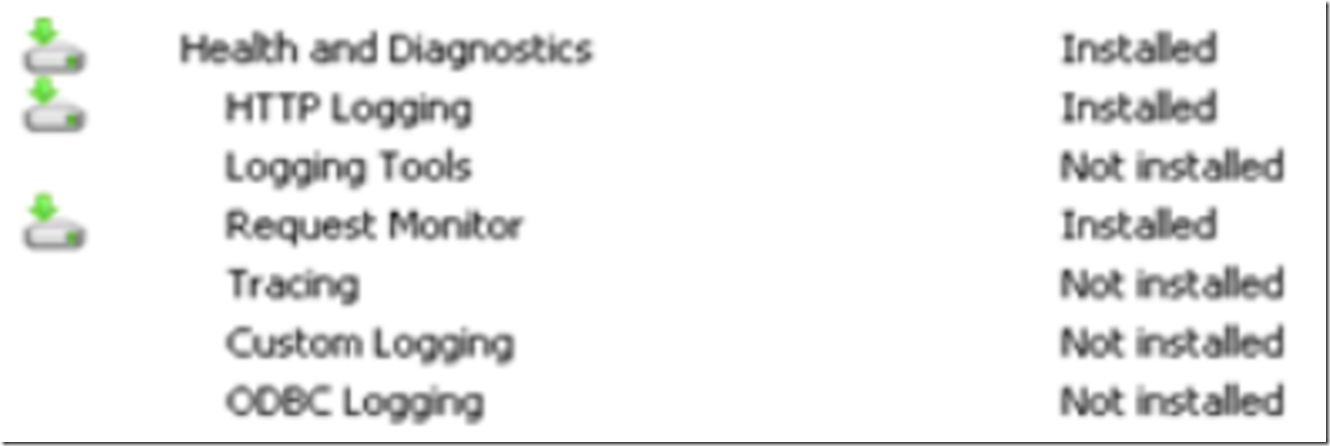
There is a new troubleshooting capability available in IIS 7, it is called Failed Request Tracing Rules. It provides a lot of very useful information which can help pinpoint the cause of performance problem or error. At the moment it is not installed by default and you may see the setting as shown in Figure 1, so to begin you need to open Server Manager, Select Roles, then within the Web Server (IIS) section, select Add Role Services.
Figure 1, default logging settings
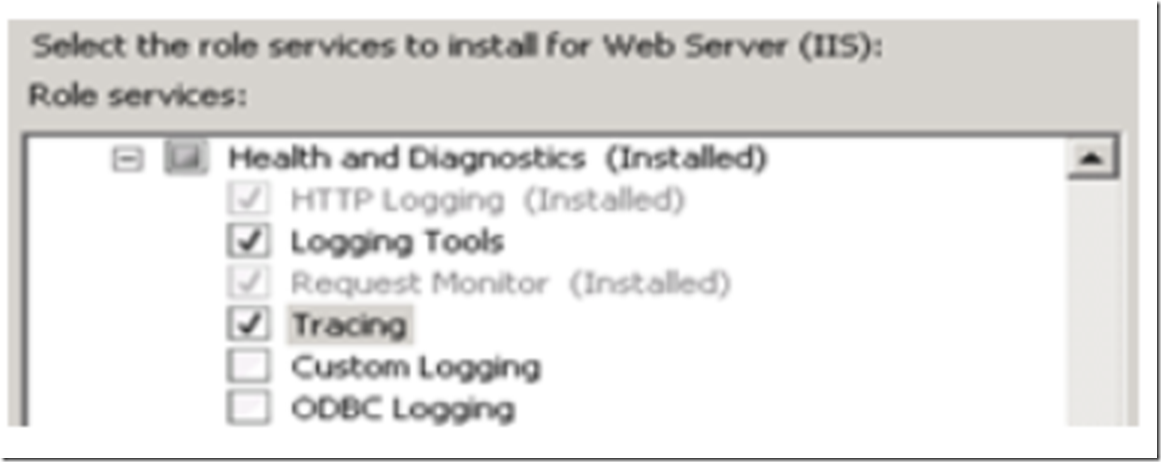
In the Add Role Services window select both Logging Tools and Tracing, as shown in Figure 2, then select Next -> Install.
Figure 2, Installing Logging and Failed Request Tracing
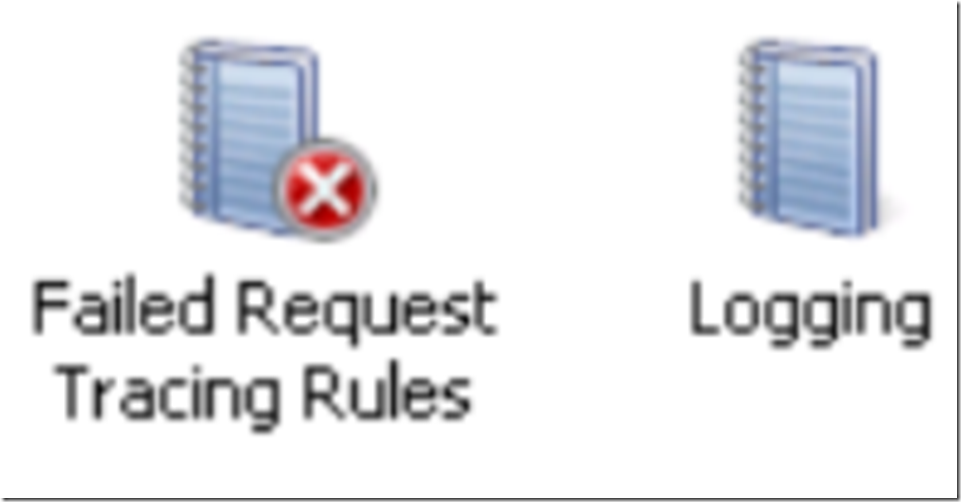
Once installed you should find the following 2 new icons, shown in Figure 3, in the Features View pane of IIS after you close and reopen the IIS manager.
Figure 3, Tracing and Logging icons
Select the Web Site which you want to enable Failed Request Tracing. Once selected, on the Actions Pane, you will see a Failed Request Tracing… link as shown in Figure 4. Select the link.
Figure 4, Configure Failed Request Tracing for a web site
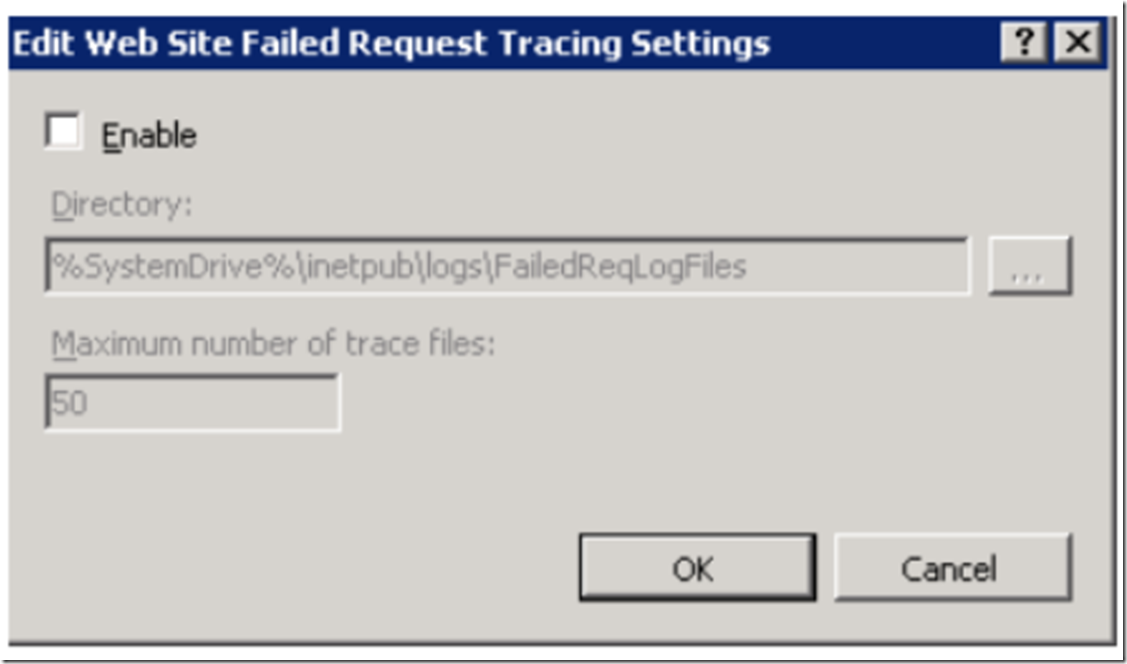
Clicking the link will open the window shown in Figure 5. Select the check box to enable this capability for the selected web site.
Figure 5, Enable Failed Request Tracing for a web site
After the check box is selected, you will be able to set the location where you want the logs to be stored and the maximum number of files. Once enabled, select OK. With the same Web Site, double-click the Failed Request Tracing Rules. This will open a view which allows the administrator to create a rule. To create a Rule, select the Add… link from within the Actions Pane as shown in Figure 6.
Figure 6, Add a Failed Request Tracing Rule
In situations where you are not sure where the problem is, I create a “catch-all” rule, which will simply log all the activities happening. Then I can go through the logs, 1-by-1 to find the errors. When doing this keep the following in mind:
- There may be a lot of files, too many to walk through manually. If this is the case, try to reduce the number of files by making the rule more restrictive
- The amount of space taken to store the logs may get large fast. Therefore, leave the logging Enabled for just the time you need it or implement a logging storage strategy.
- Doing so much logging may impact the performance of your system. So leave logging enabled for only as long as you need it or take the precautions necessary to prevent performance issues related to logging
If you do have a lot of Failed Request Tracing logs you can find a useful tool here for parsing through them faster. That aside, after selecting the Add…link from the Actions Pane you are presented with the window shown in Figure 7.
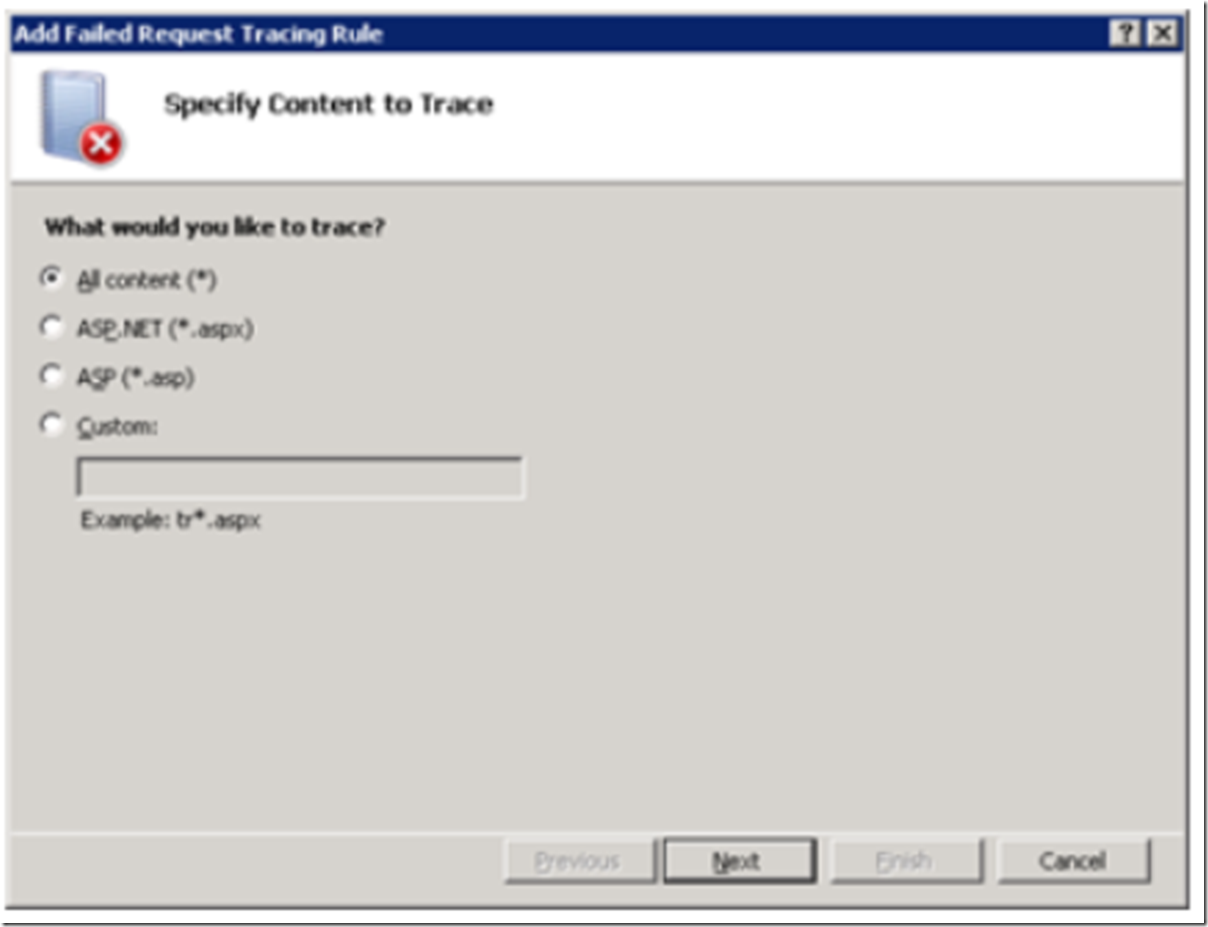
Figure 7, Step 1 – Specify Content to Trace
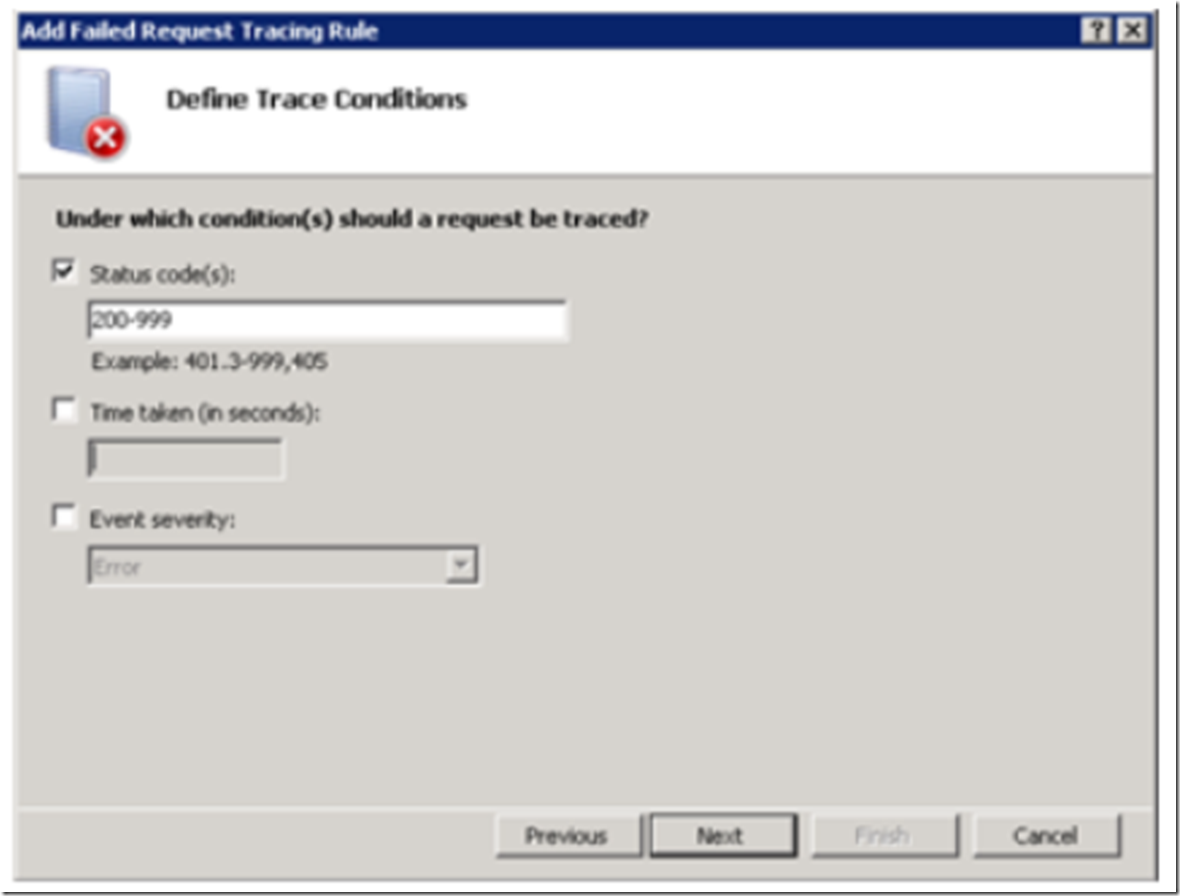
As mentioned, this example is a catch all, therefore All content (*) is selected, then select Next. Selecting Next will open the window shown in Figure 8, where you can add the trace conditions. In this example, I have decided to capture the range of status codes from 200-999. Again, this is a “catch all”. I want to capture 200, which means request OK, because although the response was successful, it may be taking a long time to process. The Failed Request Tracing log will show me where the request is taking the most amount of time. Enter the status codes you would like to capture and select Next. You see that it is also possible to set a condition base on Time Taken or Event severity. These are very good conditions to enable and leave running. Just be sure to have a logging strategy in place if you leave logging turned on for a long period of time.
Figure 8, Step 2 – Define Trace Conditions
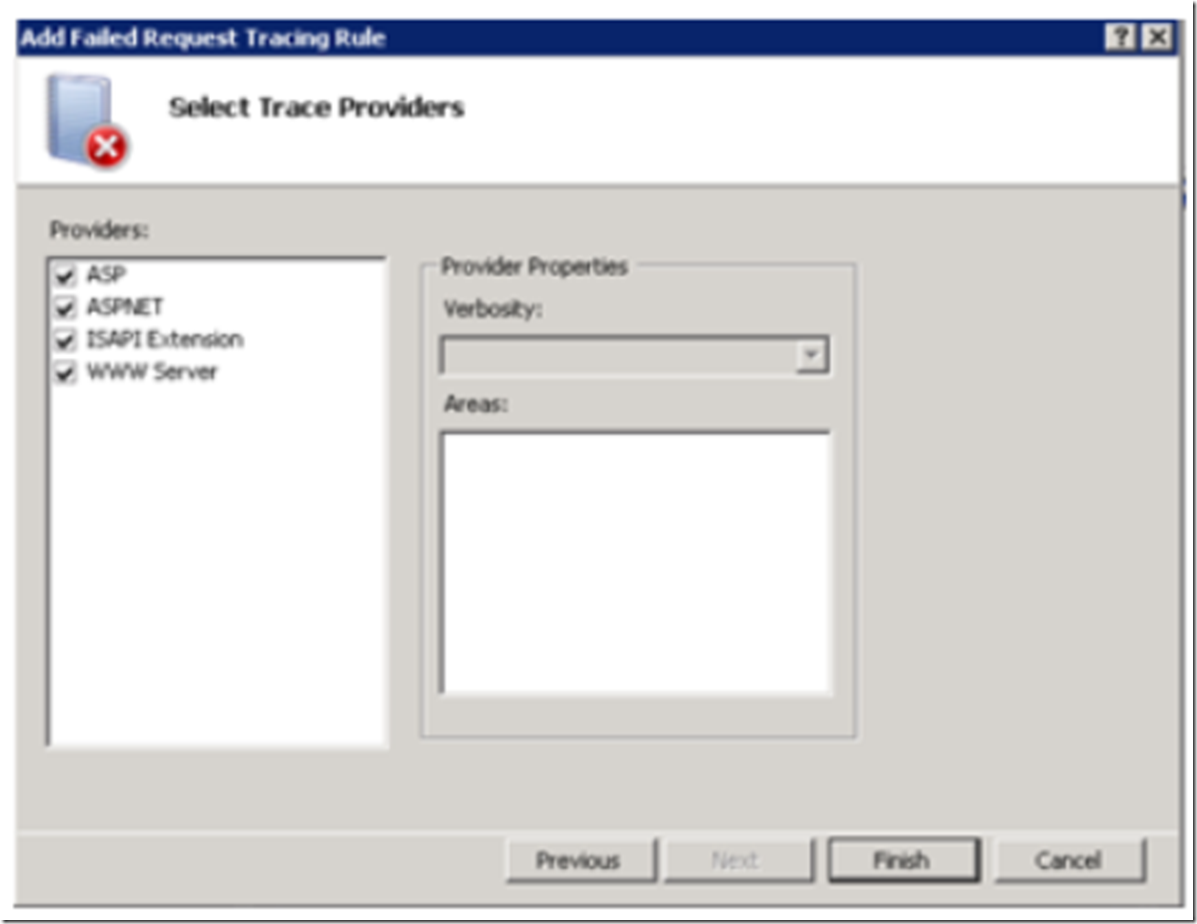
Lastly, Figure 9 provides the capability to modify the Verbosity of the logs. I will not change any setting in this example, so select Finish to complete the addition of this rule.
Figure 9, Step 3 – Select Trace Providers
You see in Figure 10, that the rule has been added and is now logging
Figure 10, Railed Request Tracing Rules list
If your web site is already having traffic then you can go to the directory you chose to store the logs into in Figure 5 and begin your analysis. You can then access your web site and reproduce the error. Just don’t forget to turn off or manage the log files you are creating, they can have impact on performance if they grow unmanaged.
