I read in this article that “Starting with the .NET Framework 2.0, you can’t catch a StackOverflowException object with a try/catch block, and the corresponding process is terminated by default. Consequently, you should write your code to detect and prevent a stack overflow.” That is the reason why the following code was crashing my process instead of the exception being caught within my try{}…catch{}.
private void ThisIsARecursiveFunctionUsedToTriggerAStackOVerflow()

{

   try

   {

     for (int i = 0; i < 1000; i++)

     {

       ThisIsARecursiveFunctionUsedToTriggerAStackOVerflow();

     }

   }

   catch(StackOverflowException ex)

   {

     lableMessage.Text = ex.Message + "<-*******->" + ex.StackTrace;

   }

   catch(Exception ex)

   {

     lableMessage.Text = ex.Message;

   }

}
But I needed to capture the exception because I wanted to look at it in a memory dump. Had I been able to capture the exception in the code then I could dump out the stack into a log and see what was going on.
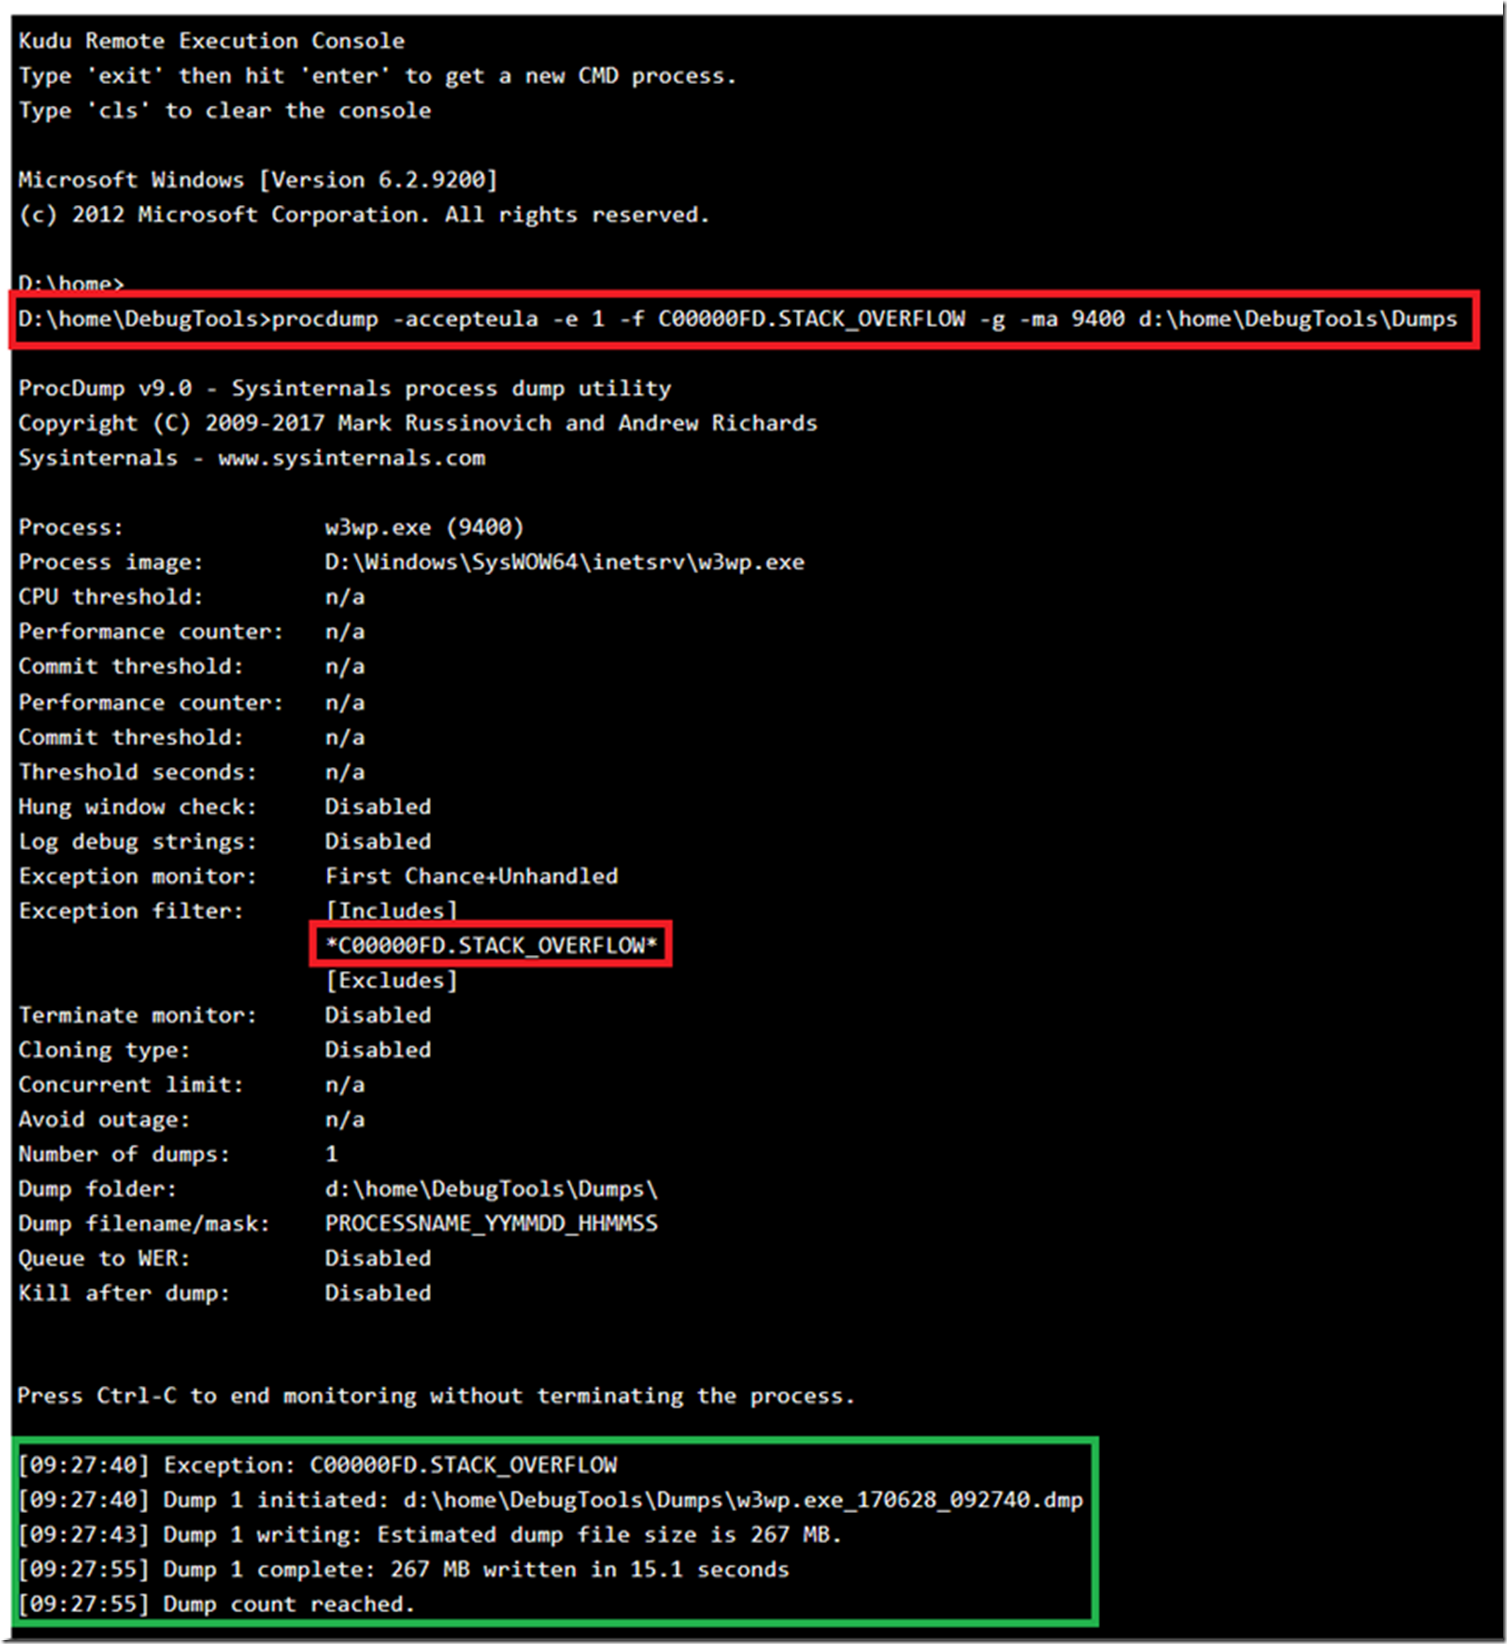
The StackOverflowException was happening in my W3WP process and I used procdump to capture the exception. Here is the command I used, also show in Figure 1 where I took it via KUDU/SCM on an Azure App Service:
procdump -accepteula -e 1 -f C00000FD.STACK_OVERFLOW -g -ma 9400 d:\home\DebugTools\Dumps
Figure 1, capture a stackoverflowexception, 0xc00000fd, C00000FD.STACK_OVERFLOW memory dump
Then navigate to the directory where the dump was created, Figure 2, download it and open in in WinDbg.
Figure 2, download a stackoverflowexception, 0xc00000fd, C00000FD.STACK_OVERFLOW memory dump
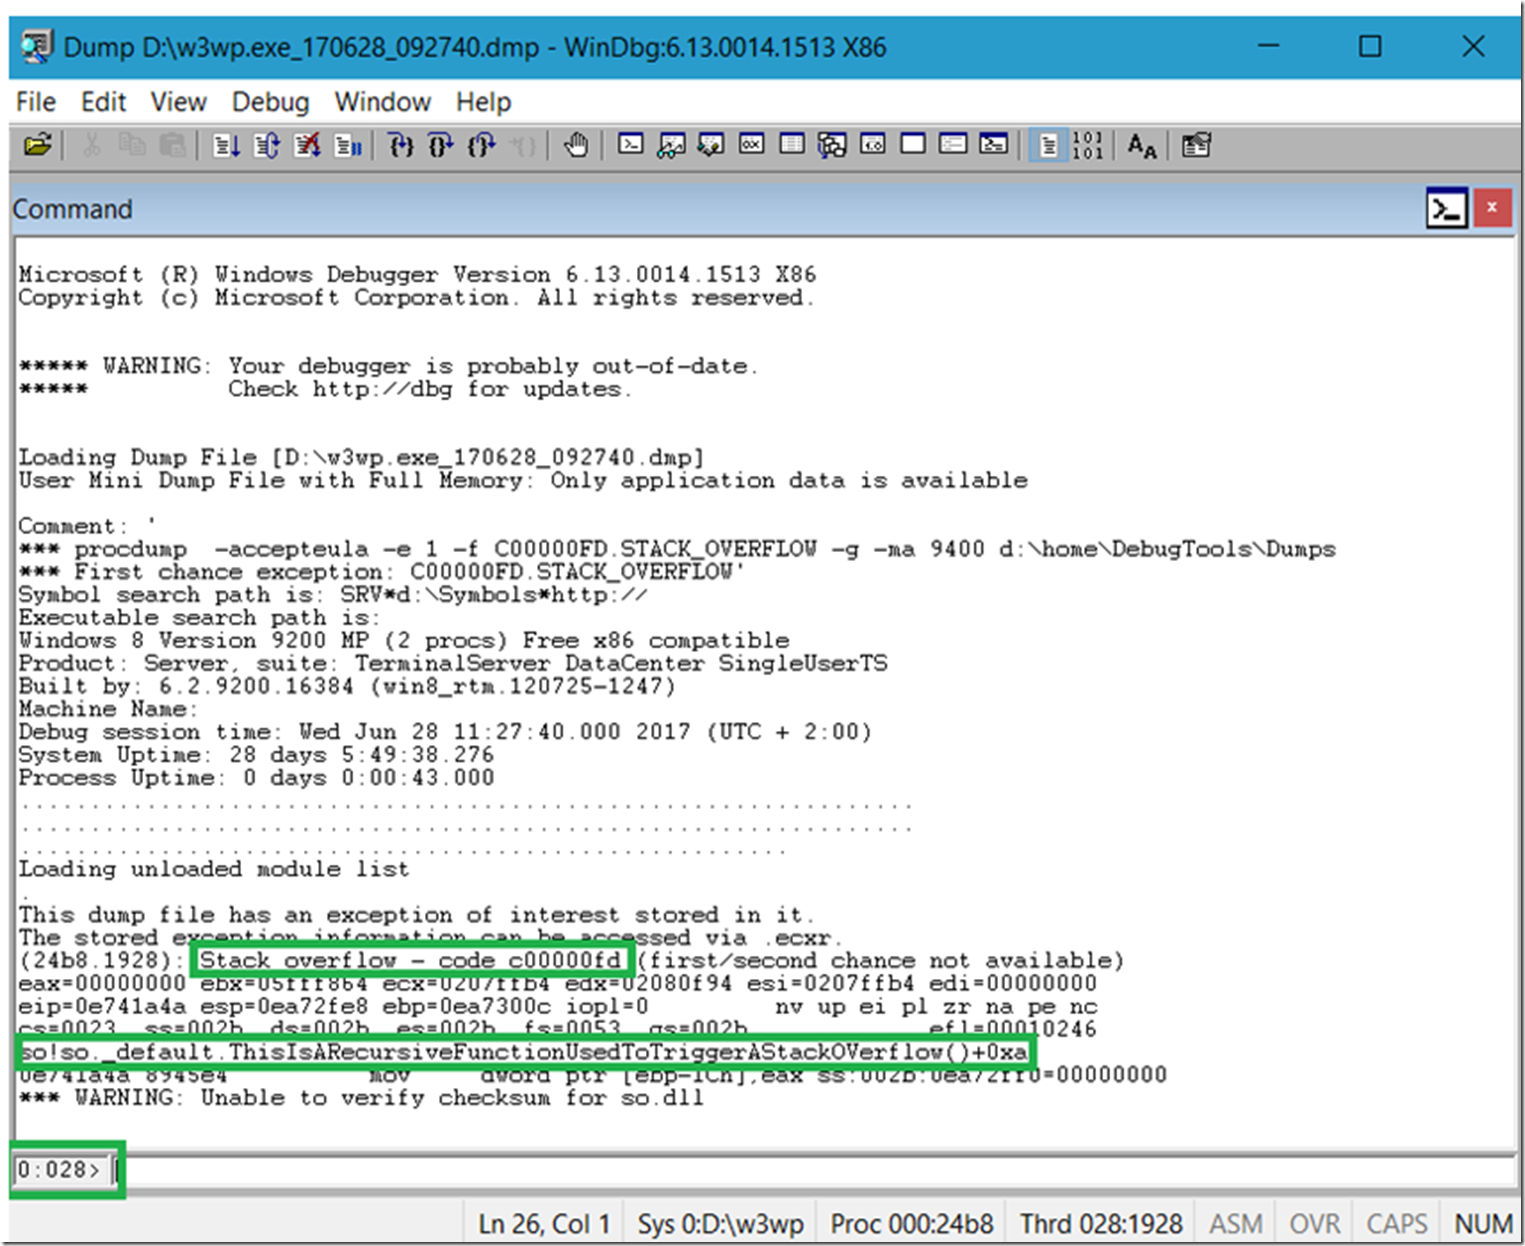
When I open the dump in WinDbg the tool recognizes the First chance exception: C00000FD.STACK_OVERFLOW’ , dumps out the method (so!so._default.ThisIsARecursiveFunctionUsedToTriggerAStackOVerflow()+0xa) and changes focus to the thread ( ~28s) which triggered the exception, see Figure 3.
Figure 3, analyze a stackoverflowexception, 0xc00000fd, C00000FD.STACK_OVERFLOW memory dump
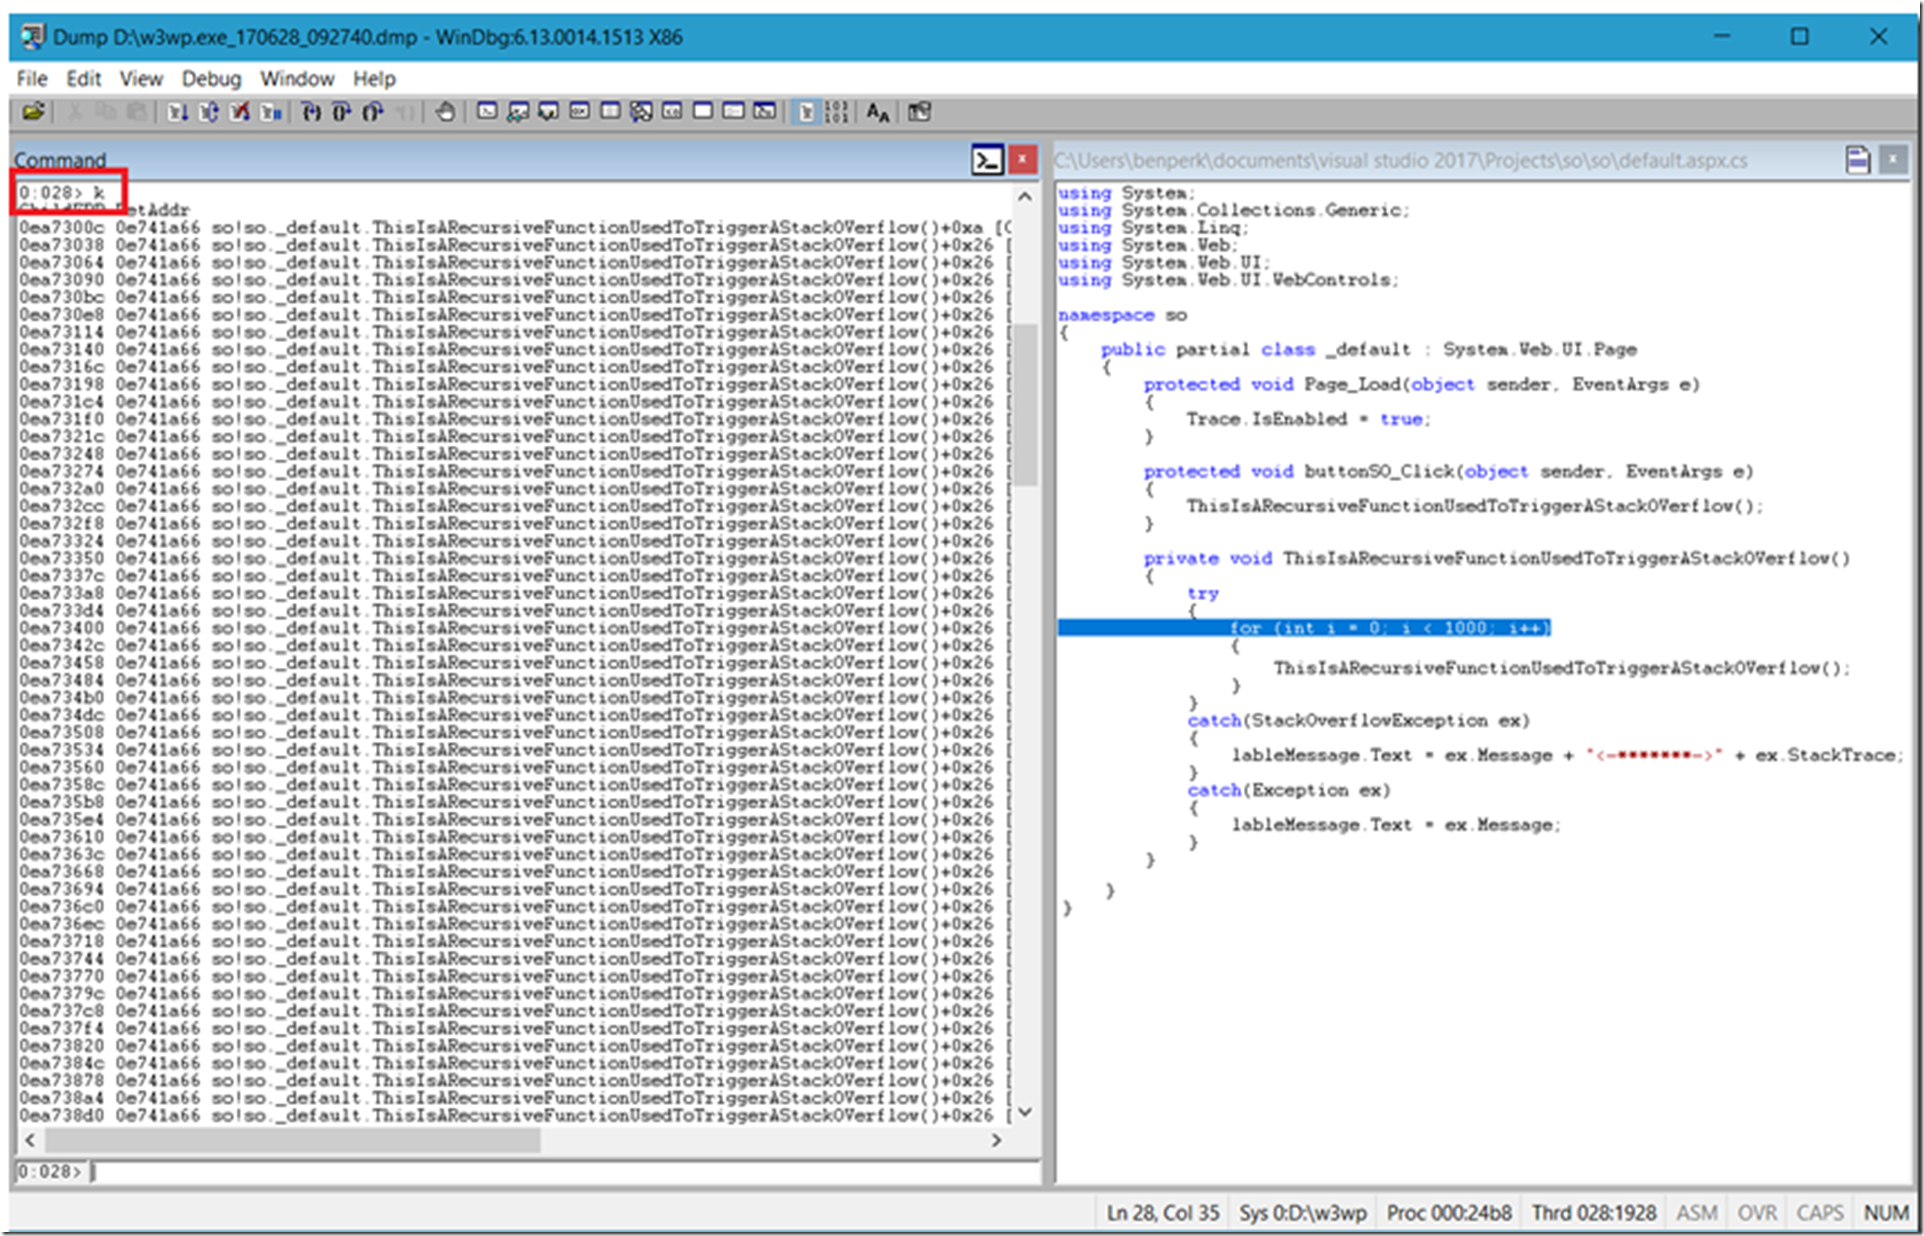
I have WinDbg configured also to view source code, so when I originally opened the dump and WinDbg found the exception, it was able to open the source code to the line in which it happened. See Figure 4. Also, enter k to view the stack on the thread which caused the exception.
Figure 4, analyze a stackoverflowexception, 0xc00000fd, C00000FD.STACK_OVERFLOW memory dump
The code is a bad pattern only used to trigger the exception, if you use recursive methods you need to protect yourself by adding a counter of some kind, because as you now know you cannot capture this kind of exception via a try{}…catch{} and because of that it is an unhandled exception which will crash the process.


