Setup
- Install Debugging Tools for Windows – For WinDbg
- Install and Configure CSharpGuitarBugs on an IIS server as described in Lab 1
- Place PROCDUMP executable on the IIS Server
- Read this HOW TO here.
- Read about the !runaway command here and copy dbghelp.dll into the c:\temp directory
Lab
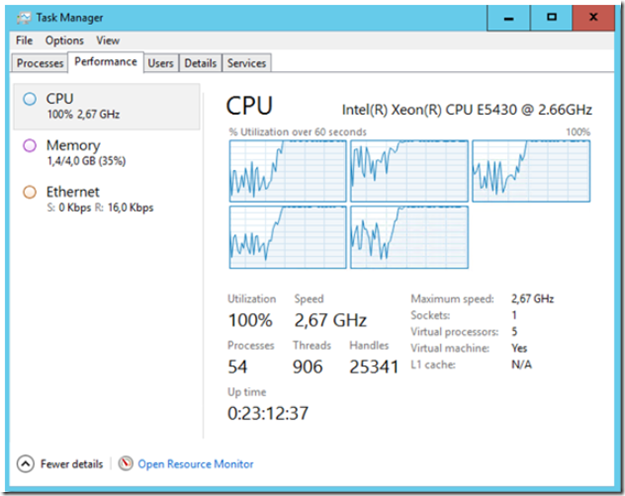
- Open Task manager so that the CPU utilization graphs are visible, Performance tab.
- Navigate to the CSharpGuitarBugs web site and click on ‘View By Manufacturer’ (note the CPU usage, open a few browser sessions). Q: which process is consuming the CPU? A: The W3WP.EXE as shown on the Details tab of Task Manager.
Figure 1, Debugging a high CPU hang W3WP process using WinDbg
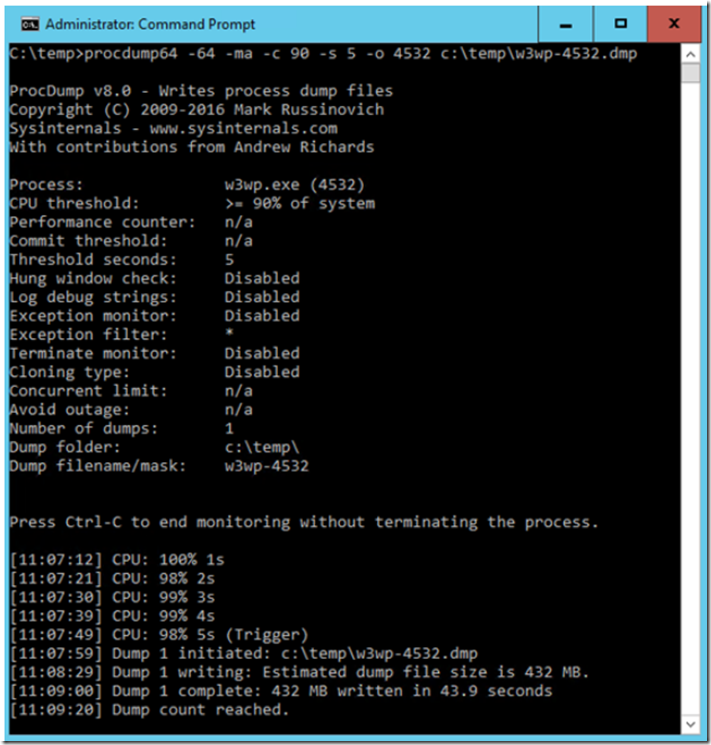
- Configure ProcDump to capture a memory dump when the W3WP process consumes over 90% of the CPU for over 5 seconds. Enter the following command, after finding the PID of the W3WP process running the website. a. C:>procdump64 -64 -ma -c 90 -s 5 -o PID c:\PID.dmp b. Be sure to use the correct procdump with regards to the bit version of the OS
Figure 2, Debugging a high CPU hang W3WP process using WinDbg
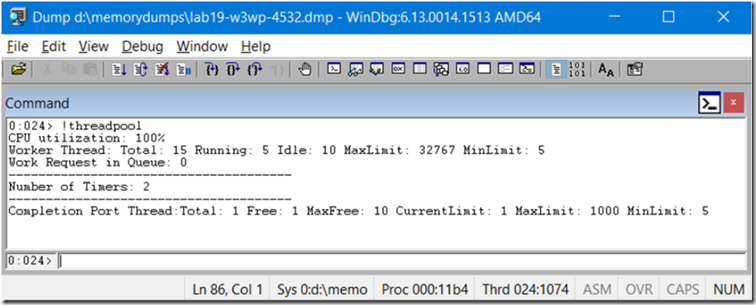
- Open the memory dump in WinDbg and load the SOS.dll version corresponding to the .NET version which the web site is running in. For example, the one I used was C:\Windows\Microsoft.NET\v4.0…\SOS.dll. a. .load \sos.dll b. !threadpool – Q: Is this the CPU of the process or System? A: This is the System consumption, but we are confident that the W3WP process is the one consuming it all.
Figure 3, Debugging a high CPU hang W3WP process using WinDbg
Q: What happens with new requests when CPU utilization is greater than 80%? A: No more ASP.NET threads will be created, also the Garbage Collector sets this to 81% when GC runs so that no more threads are created. if the CPU is at 81% check if a Garbage Collection is running.
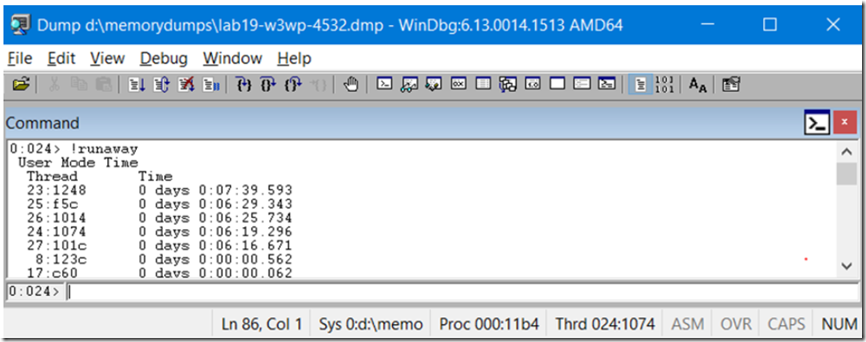
c. !runaway – The once consuming the most amount of time are of most interest, but not always the reason for the problem
Figure 4, Debugging a high CPU hang W3WP process using WinDbg
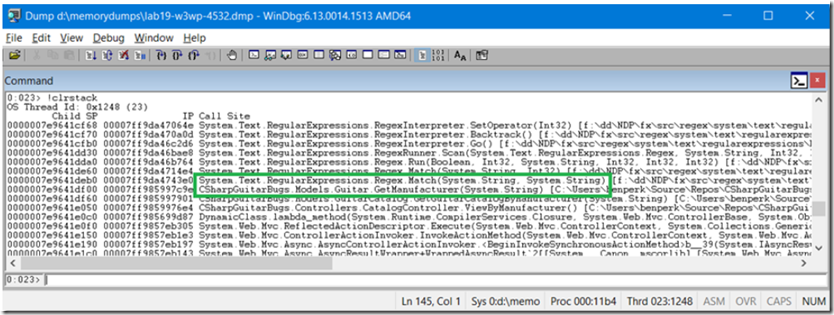
d. Change focus to thread 23 -> ~23s, (thread is most likely a different number in your dump) then look at the stack kb 2000 (include native methods) and !clrstack (anaged only methods) What is happening on the thread?
Figure 5, Debugging a high CPU hang W3WP process using WinDbg
It appears that the GetManufacturer() method is running the Regular Expression Regex.Match() method and is poorly written. Review the expression and see why it is taking so long.
