Prerequisites
- Read this, using ADPLUS here
- Download/Read about Procdump here
- Have a look at Lab 19 and Lab 20, for other examples of Procdump
- Review this blog here
Setup
- Install and Configure CSharpGuitarBugs on an IIS server as described in Lab 1
- Install and Configure Failed Request Tracing on the same IIS server as described in Lab 4
- Copy PROCDUMP.exe to the c:\windows\system32 directory on the IIS server
LAB
Perform the following to configure Failed Request Tracing to capture a memory dump
- Configure a Server Level Failed Request Rule to run when the Status Code = 400-599 (seems to work best when the rule is base on Time Taken)
Figure 1, Configuring Failed Request Tracing to take a memory dump
Figure 2, Configuring Failed Request Tracing to take a memory dump
- Open the IIS management console and click on the IIS Server name
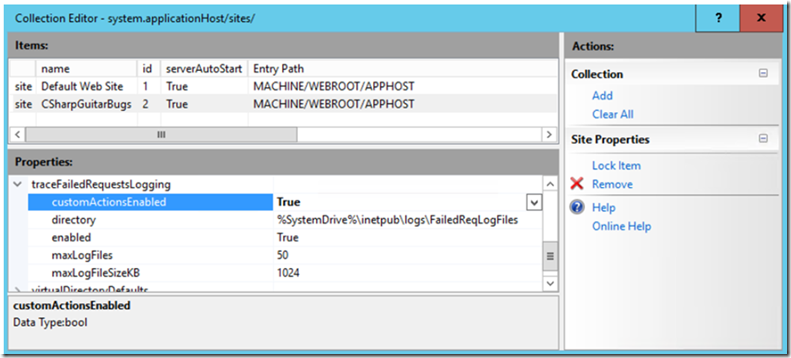
- Open the Configuration Editor
Figure 3, Configuring Failed Request Tracing to take a memory dump
- Click on the … of the (Collection) and set customActionEnabled and enabled to TRUE
Figure 4, Configuring Failed Request Tracing to take a memory dump
- Then, Apply the changes
- Download and copy ProcDump
a. http://technet.microsoft.com/en-us/sysinternals/dd996900.aspx
b. Copy Procdump.exe (procdemp64.exe) into the c:\windows\system32 directory, create a c:\temp\dumps directory to store the dump
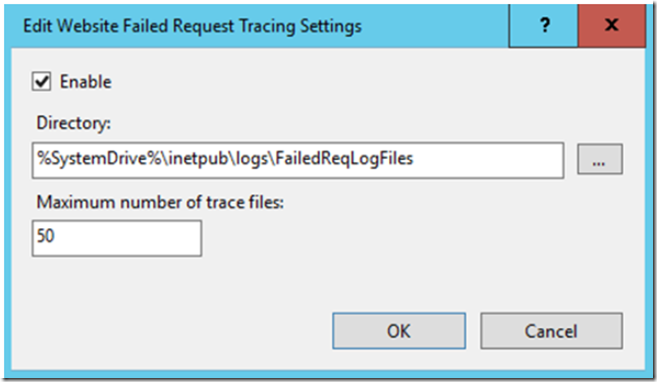
- Click on the Failed Request Tracing… link, for the CSharpGuitarBugs website, in the Actions pane and Enable it.
Figure 5, Configuring Failed Request Tracing to take a memory dump
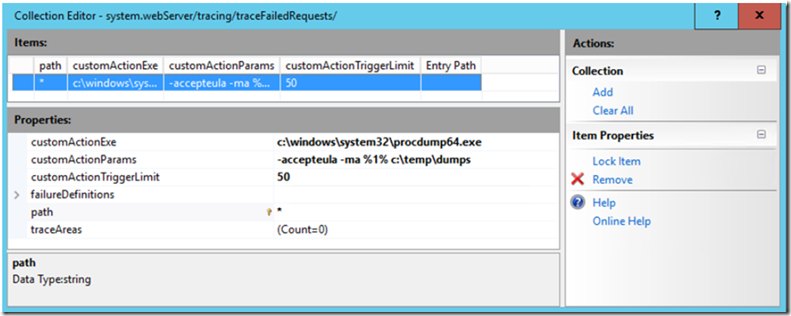
- Click on the CSharpGuitarBugs Web Site, then on the Configuration Editor
Figure 6, Configuring Failed Request Tracing to take a memory dump
- Click on the … and Add the following
a. customActionExe: c:\windows\system32\procdump.exe
b. customActionParams: -accepteula –ma %1% c:\dumps
c. customActionTriggerLimit: 50
d. path: *
Figure 7, Configuring Failed Request Tracing to take a memory dump
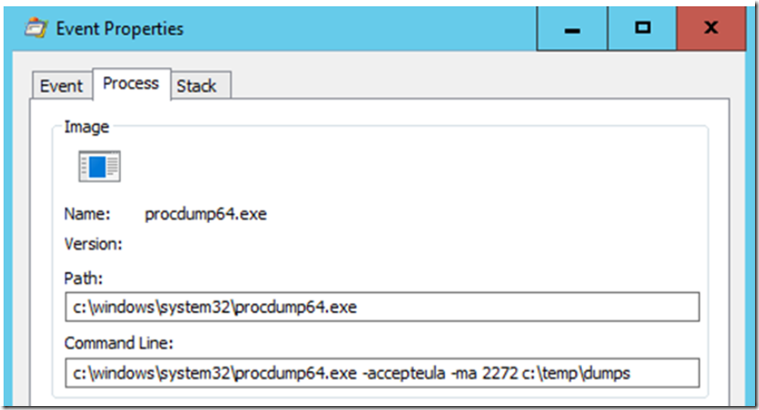
- Apply the changes and click on the Search Forums link in the CSharpGuitarBugs website, or with the Time Take rule, click on the View By Manufacturer link…, notice that the %1% is the parameter that passes the PID to Procdump.
Figure 8, Configuring Failed Request Tracing to take a memory dump
Figure 9, Configuring Failed Request Tracing to take a memory dump
- A memory dump of the W3WP process is created and placed in the c:\temp\dumps directory. You can now use WindDbg or any other memory dump analysis tool to find out the root cause of the issue.
Figure 10, Configuring Failed Request Tracing to take a memory dump


