There are numerous ways to create a memory dump for a slow performing Web App, but I find this one the simplest and quickest. Follow these steps to capture a memory dump of the W3WP process responding to requests which are slower than expected. Here are the steps:
- Login to your KUDU console. I wrote a short description of what KUDU is here. Basically, KUDU is a service that provides many features for supporting and monitoring your Web App. It is accessed by placing ‘scm’ into your Web App URL. For example, if your Web App URL is http://contoso.azurewebsties.net then your KUDU URL is https://*.scm.azurewebsites.net.
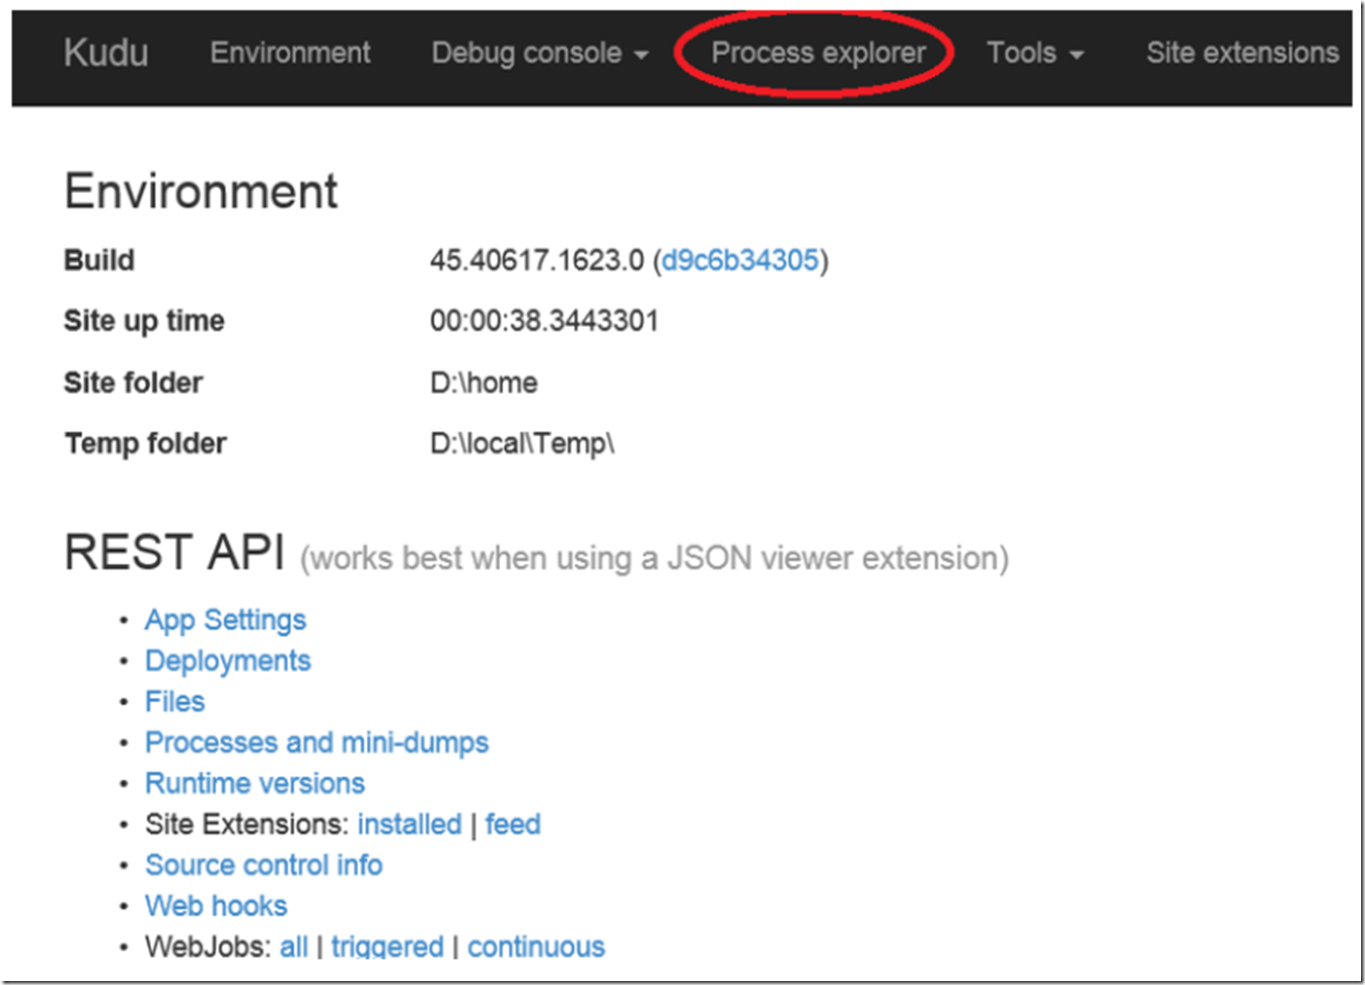
- After logging in, select Process explorer, as shown in Figure 1.
Figure 1, Accessing Process explorer for your Azure Web App
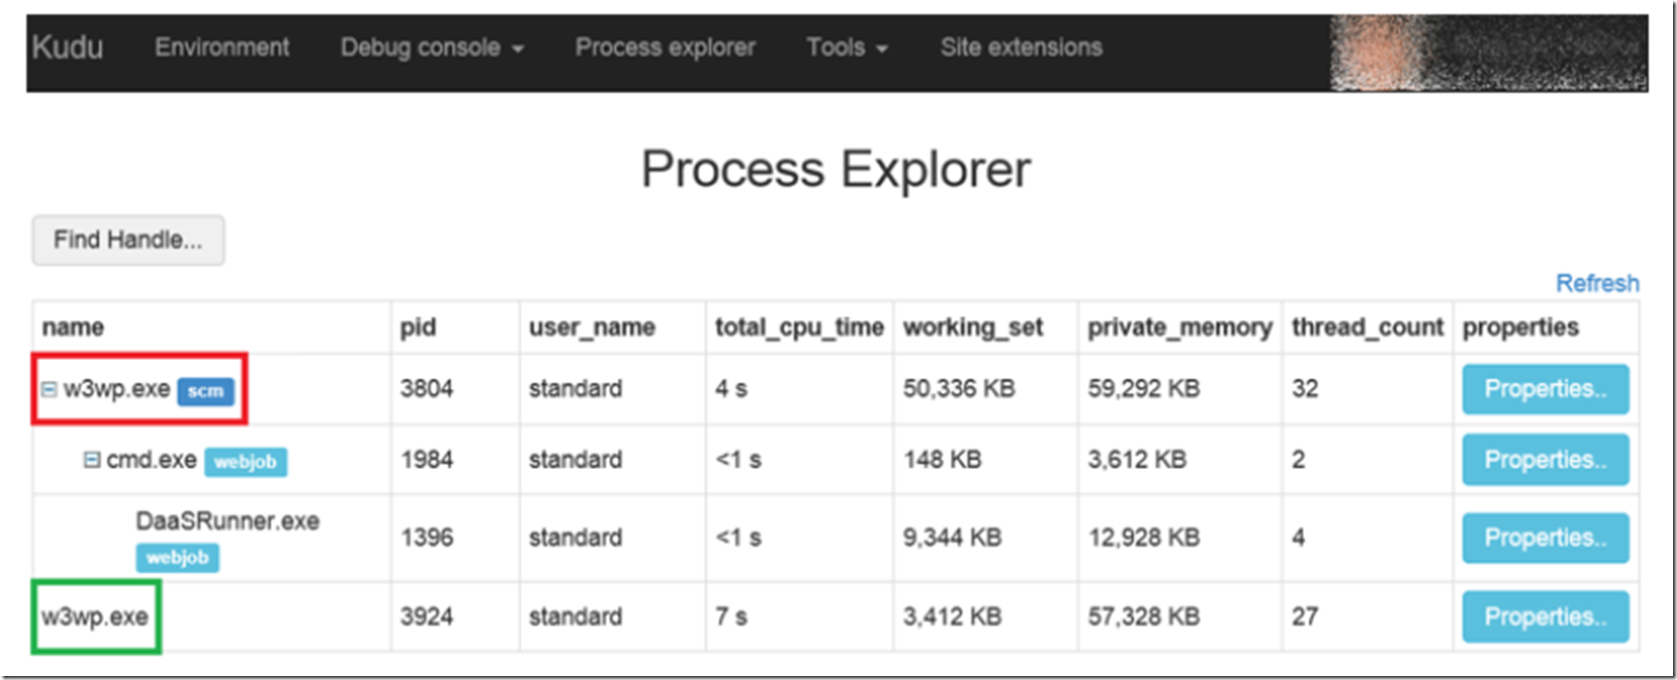
- Once you see the Process explorer page, as shown in Figure 2, observe the running processes on your Web App VM. The W3WP.exe process in the red box is the one running the KUDU site and your WebJobs, notice the blue boxes next to the processes. The W3WP.exe process in the green box is the one responding to requests to your Web App.
Figure 2, Azure Web App Process Explorer
- Timing is of the essence during the completion of the next 2 steps (#4 and #5), so please read them both before proceeding so you are ready to complete them in quick progression. Execute the request which is taking a long time from another browser or from another tab within the same browser instance, where the request comes from is not the point here really. Just make the request which is slow running on the Azure Web Apps platform.
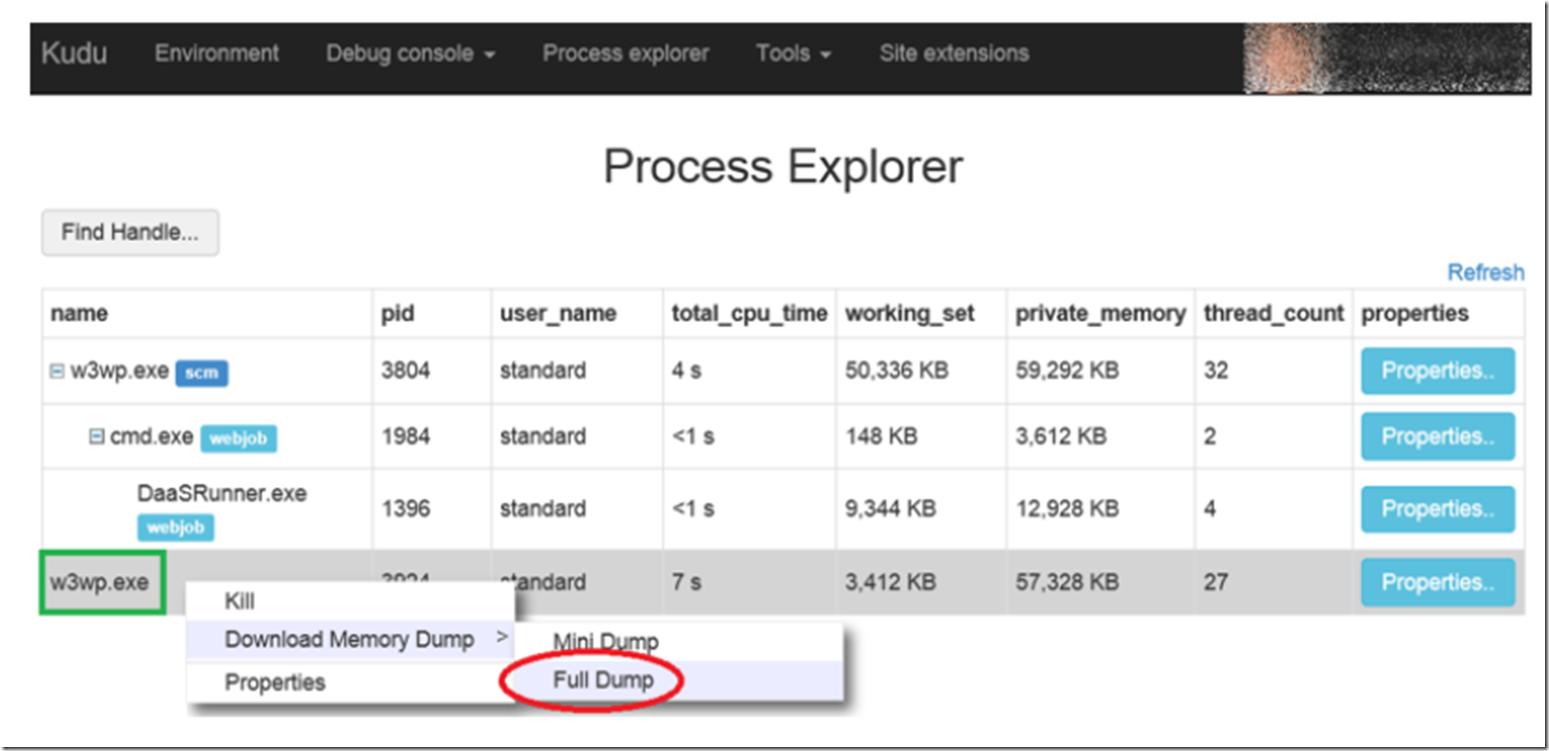
- While the request is running, preferably when you notice it is hung, right-click on the W3WP process, in the green box and select Download Memory Dump -> Full Dump, as illustrated in Figure 3. You must take the memory dump ‘while the request is running’ and in the ‘hung state’. Otherwise the contents contained in the dump file will not provide any value.
Figure 3, create a W3WP dump for an Azure Web App that is slow
NOTE: I had a little problem capturing the dump when the Web App was in FREE mode. Perhaps I was just impatient. I scaled to BASIC and, in this mode I was able to get the memory dump. If you experience the same, just scale to BASIC for some minutes, reproduce the issue again, capture the memory dump and scale back down. No problem.
- It may take a moment to capture the dmp file, however once it is created, you should get prompted to save the dmp file, as shown in Figure 4. Save the dump file and analyze it using Debug Diagnostic or WinDbg.
Figure 4, save the Azure Web App W3WP process memory dump
See this blog for more discussion about how to analyze the contents of a W3WP memory dump using WinDbg.


