There are many reasons why an IIS worker process can hang. For example, a long running SQL query, searching through a Dictionary object, a non-optimal Regex command, hitting the limits of the process model configuration, etc… can all cause performance to slow.
Previously, I wrote a blog about using the !dtc command in WinDbg. This command shows the settings for the process model at the time the memory dump was taken.
This article will discuss the way to find out if your performance issue is caused by the maxConnection element limit being reached. When the maxConnection is being hit you may find the following errors in the Event Viewer:
- (PID: ) was recycled because it was suspected to be in a deadlocked state.
- xxx reported itself as unhealthy for the following reason: ‘Deadlock detected’.
Recall that the default algorithm for calculating the maxConnection element is:
(maxWorkerThread – minFreeThreads) * Number of logical processors
What this means is that the maxConnection value is calculated based on the capacity of the server. I.e. the more logical processors you have the greater number of connections you can have……finally found an opportunity to use that one, yes! And to me that makes sense, the more capacity you have the more work you can do.
So how do you check and see if the maxConnection is being reached? When the slow performance is happening, take a memory dump of the W3WP process for the given worker process. How to do this can be found here for Windows 2003 and here for Windows 2008. Open the memory dump in WinDbg and enter the following command:
!dumpheap -stat -type HttpWebRequest
I use the -stat parameter just in case there are a lot of them. In this case there are ~150, which is not so many so I enter the following and get a list of all HttpWebRequest objects.
!dumpheap -type HttpWebRequest
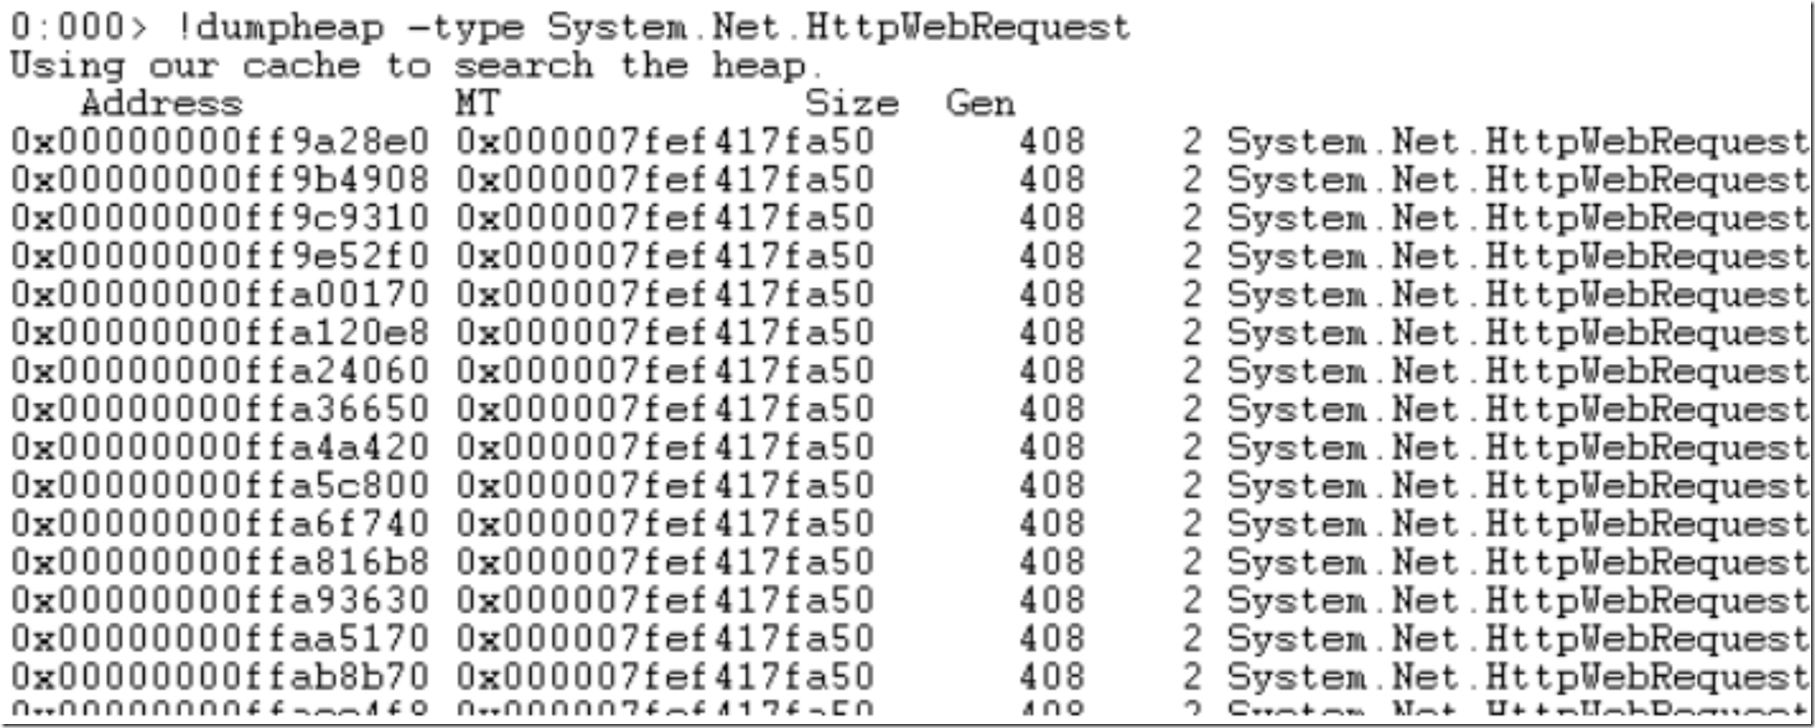
This command provides the address location for each of the HttpWebRequests. Figure 1 displays a subset of those results.
Figure 1, !dumpheap -type HttpWebRequest example
To look at the specific details for a given HttpWebRequest, enter the following command:
!do 0x00000000ff9a28e0
!do is short for Dump Object. The !do command requires the address space of the opbject that you want to see. I picked the first one on the list under the Address column: 0x00000000ff9a28e0. Figure 2 shows the result of the !do command using the HttpWebRequest address.
Figure 2, Using !do to get the HttpWebRequest settings
Within the output shown in Figure 2, search for the _ServicePoint Name and Value. Once found, perform another !do command using the Value that is associated with the Name. In this case I used 000000013fb0c1b8. The actual command is below and the results are shown in Figure 3.
!do 000000013fb0c1b8
Figure 3, Using !do to get the maxConnection and CurrentConnection values
Search for m_ConnectionLimit and m_CurrentConnections and you can concur that there is a problem here because the limit is equal to the current number of connections. Performing a !dtc which was discussed here, shows the same maxConnection limit as found previously in the ServicePoint. See Figure 4 for the output of the !dtc in this memory dump.
Figure 4, !dtc output
You can confirm that the number of processors on the machine is 2, the MaxWorkerThreads is 100 and the minFreeThreads value is 88.
(100 – 88) * 2 = 24 or (200 – 176) = 24
To solve this situation you can optimize the code which is taking some time to complete, increase the capacity on the server or lastly, but not my preferred is to increase the maxConnection setting in the machine.config file. Note that simply increasing the maxConnection value may make the situation worse and not better. This is because adding the ability for more connections will likely add more load on the server and if the server is already having this problem, you are just extrapolating it by allowing more connections.


