If you want to find out why a W3WP worker process is consuming so much CPU, you can use ProcDump. You might also use LogParser to look at the time-taken field, but to get to the root cause you will need to get deep into the source. Before you can get a memory dump, you need the PID of the worker process. You can get the PID in a number of ways. Below I illustrate using either PowerShell or AppCmd, for example.
Here is a previous article I wrote that covers how to get the PID of a worker process in PowerShell. Figure 1 illustrated the specific PowerShell command.
Figure 1, finding the W3WP PID using PowerShell
You can also find the PID using AppCmd, as shown in Figure 2. I wrote a more detailed article about how to do this here.
Figure 2, finding the W3WP PID using AppCmd
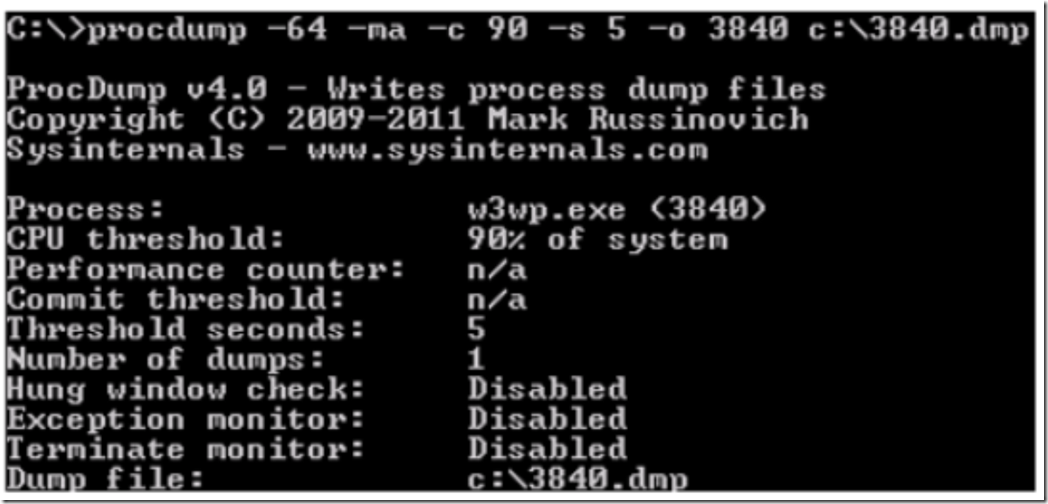
When you have found the PID (Process ID), you can use it as a parameter of the ProcDump command. Enter this ProcDump command, shown in Figure 3, to capture a 64-bit full memory dump when the CPU consumption is greater than 90% for 5 seconds:
C:>procdump -64 -ma -c 90 -s 5 -o PID c:\PID.dmp
Figure 3, a ProcDump command to capture CPU consumption
Then you can use tools like Debug Diagnostic or WinDbg to analyze the memory dump and find out what is consuming the CPU.


