When you are experiencing slow performance on your Azure App Service #Microsoft a start is to look at the IIS logs, specifically at the time-taken column. This will confirm that indeed there are some slow requests and identify better how slow they are. If you want to take it one step further, you can enable Failed Request Tracing which help identify where in the request pipeline the request is hanging. I discussed Failed Request Tracing in more detail within one of my IIS labs here, specifically Lab 4.
To enable Failed Request Tracing on you Azure App Service, add the following code snippet to the root web.config of your App Service. Add it within the <system.webServer> section.
<tracing>

  <traceFailedRequests>

  <remove path=”*” />

  <add path=”*”>

   <traceAreas>

    <add provider=”ASP” verbosity=”Verbose” />

    <add provider=”ASPNET” areas=”Infrastructure,Module,Page,AppServices” verbosity=”Verbose” />

    <add provider=”ISAPI Extension” verbosity=”Verbose” />

    <add provider=”WWW Server” areas=”Authentication,Security,Filter,StaticFile,CGI,Compression,Cache,RequestNotifications,Module,FastCGI” verbosity=”Verbose” />

   </traceAreas>

   <failureDefinitions timeTaken=”00:00:05″ />

  </add>

</traceFailedRequests>

</tracing>
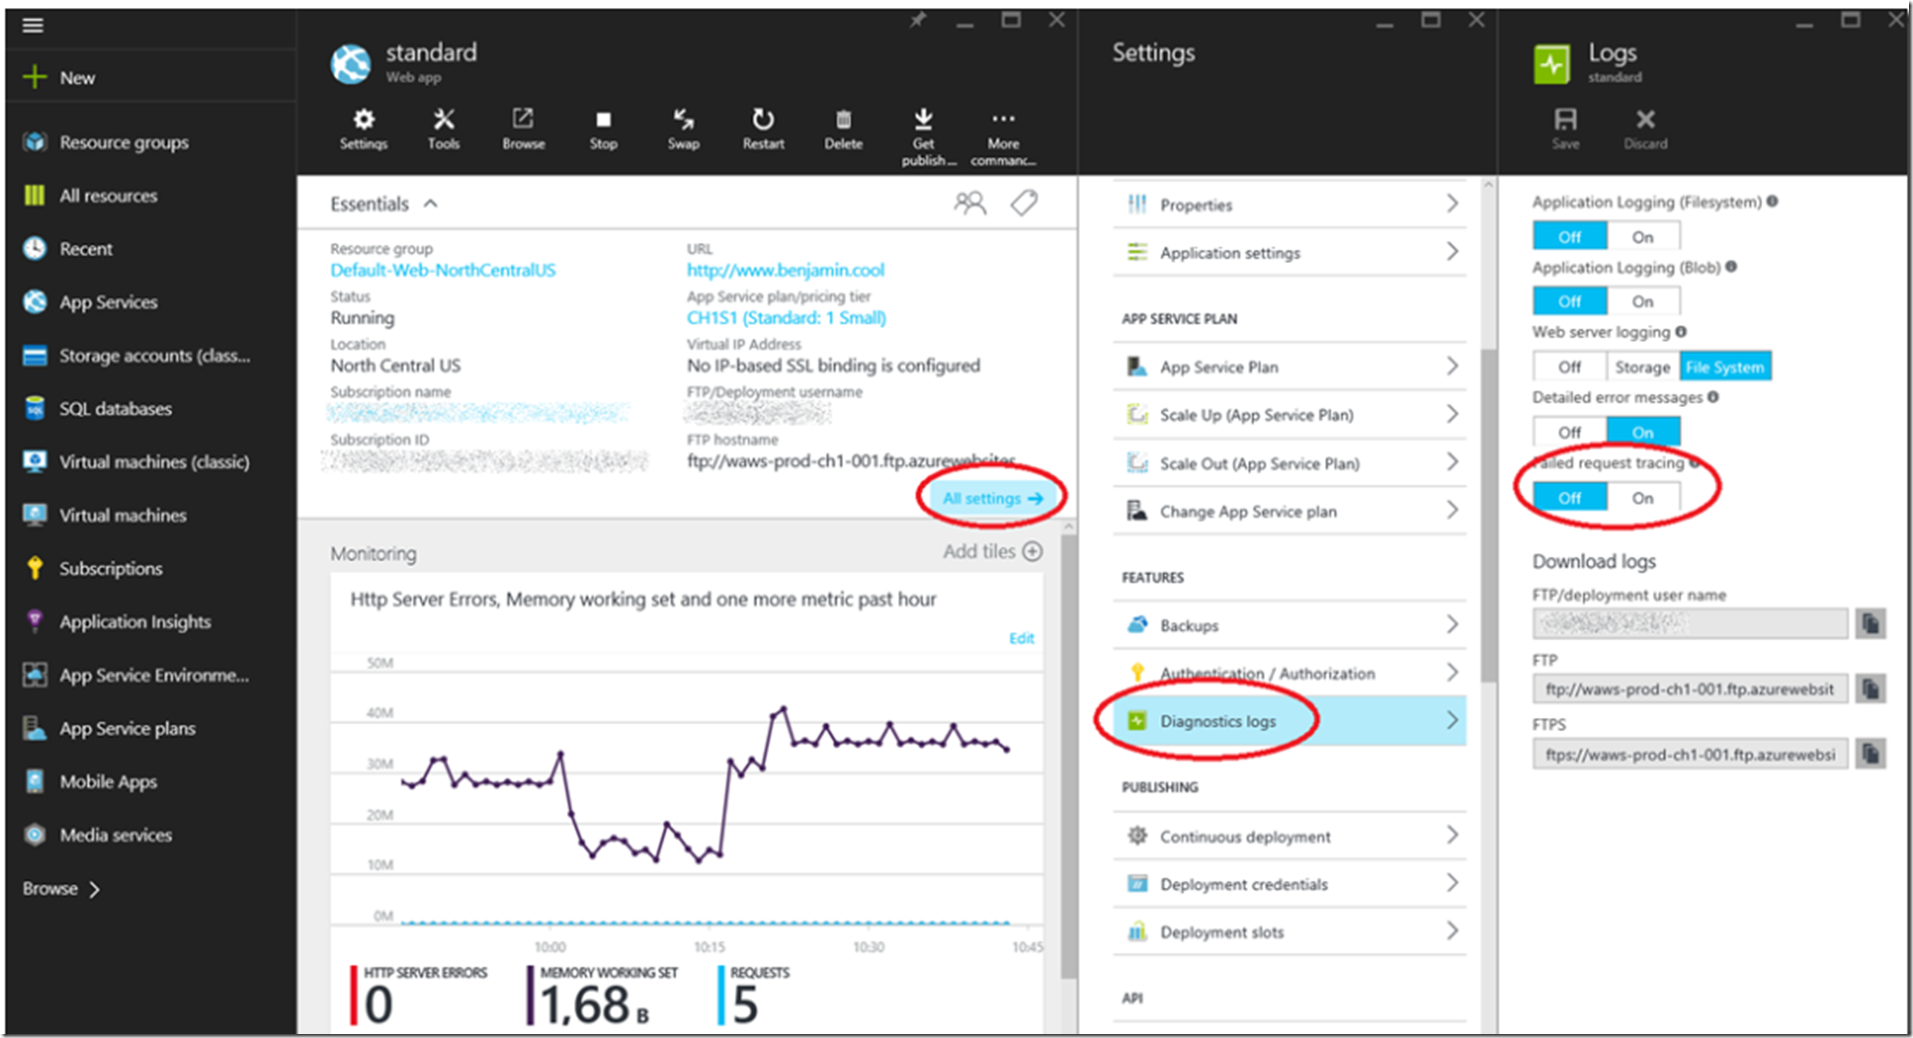
Notice that the timeTaken value is 5 seconds. This means that any request that takes 5 seconds or longer to execute, the request gets logged. Then, as shown in Figure 1, access the Azure Portal here and enable Failed Request Tracing.
Figure 1, how to enable failed request tracing, why is my Azure Web App slow
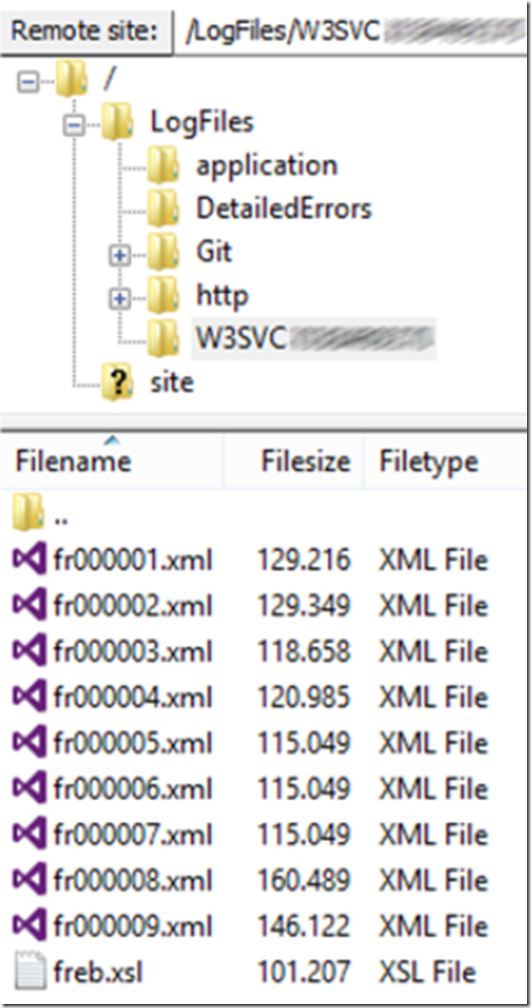
Once a log is written you can find the logs written into the d:\home\LogFiles\W3SVC* directory, as shown in Figure 2.
Figure 2, why is Azure slow
Analyze the trace file to find the specific request that is slow. Here are some links that explain how to analyze the file and more details about the feature:
- Enabling Failed Request Logging on a Windows Azure Web Site
- Lab 4: Install and configure Failed Request Tracing
Then once you find the slow page, and it is reproducible, you can capture a memory dump, analyze it and find the slow method. Here are some links that describe that in more detail:
- Create a memory dump for your slow performing Web App
- Analyze a memory dump using the Debug Diagnostic tool
- How to take a memory dump from a specific App Service instance
This should get you close to the reason of the slowness.

