If you ever need to capture trace from within the Azure Portal to troubleshoot an issue, here are the steps required to do that.
- Login to the portal here.
- Navigate to the step just prior to where the issue is happening. Press F5 or refresh.
- Press F12 to start the browser Developer Tools (IE and Edge)
- Click on the Network, stop the tracing and click on the clear session button
- Start the session and reproduce the issue
- Stop the trace and save as an HAR file
Here are more details about each of the steps:
In regards to point #2, it is important to only enable the tracing after you have already logged, because if logging is enabled when you login, then the log will include some sensitive data which would require some actions on your side to maintain the integrity of your account. Also, pressing F5 or refreshing will remove any unnecessary cached values.
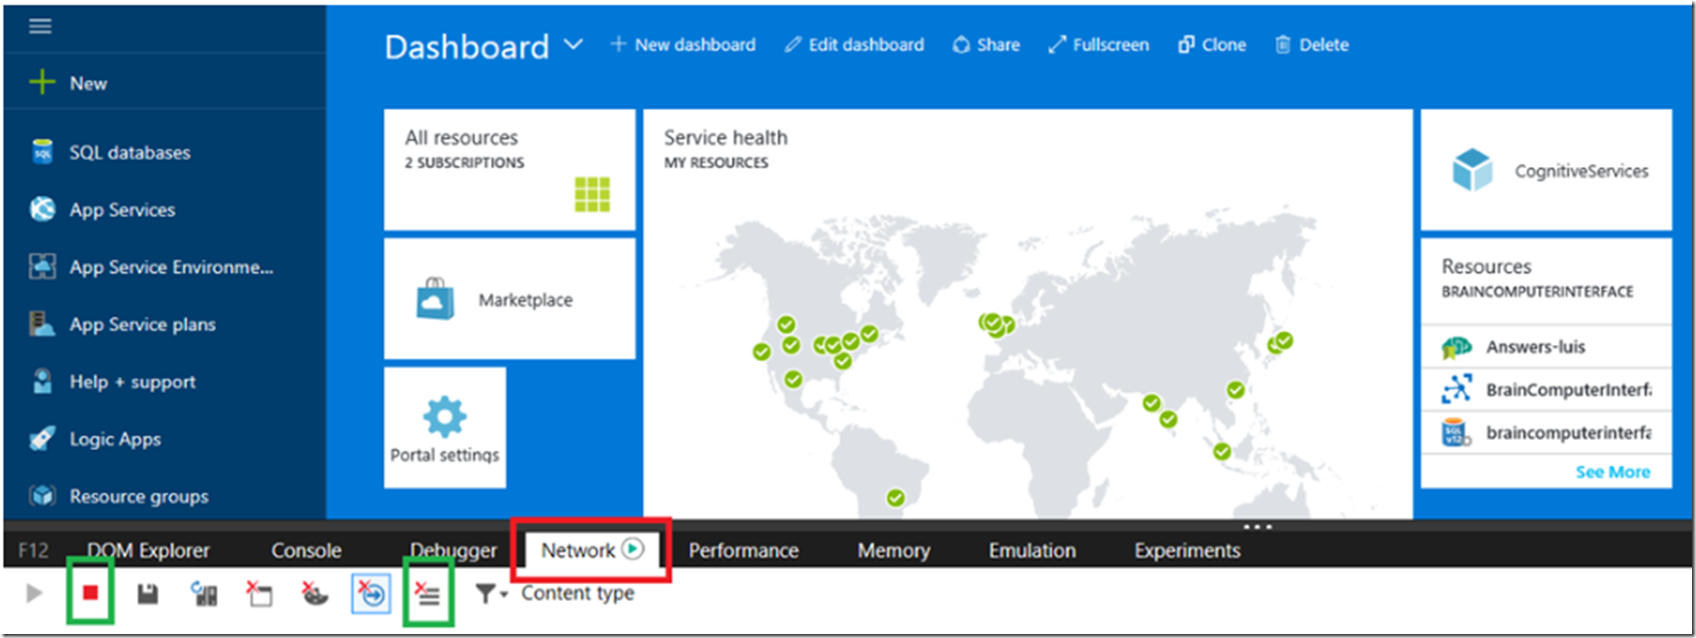
In IE and Edge pressing the F12 open a console within the browser that provides some troubleshooting and debugging capabilities. As per #3, pressing the F12 should render something similar to Figure 1.
Figure 1, enable F12 developer tools for capturing a trace in the Azure Portal
Click on the Network tab and click on the red stop button and the Clear session button also shown in Figure 1, as per #4. The F12 Network tab will resemble something similar to that shown in Figure 2.
Figure 2, stopping F12 Developer Tools network trace
Start the session and reproduce the issue as per #5. You will then see output on the tab looking something similar to that shown in Figure 3.
Figure 3, capturing an HAR trace using F12 from Edge
Finally, as per #6, stop the tracing and save the trace as an HAR file by clicking on the save button, as illustrated in Figure 4.
Figure 4, save the HAR trace file for debugging
Compress the HAR file and send it to support for analysis and solution.


