Prerequisites
Setup
- Install and Configure CSharpGuitarBugs on an IIS server as described in Lab 1
Lab 10-1
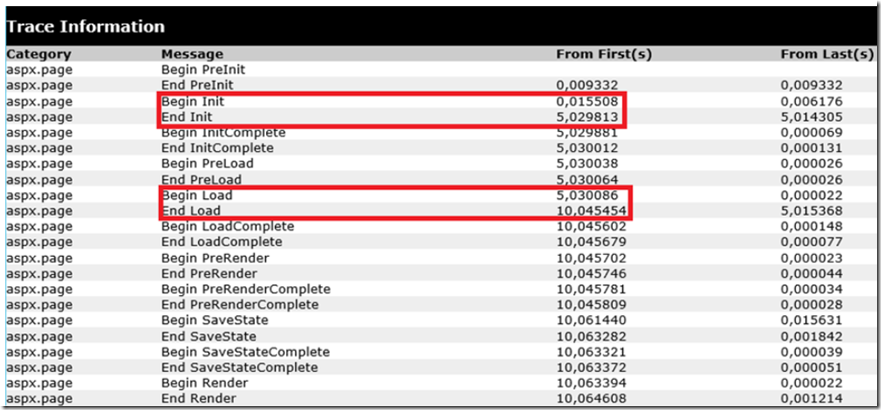
- Click on the the FullCatalog –ASPX page located within the CSharpGuitarBugs website. About how long did it take? The goal is to find out in which ASP.NET pipeline event is the code executing the longest.
- Open the WebForms/Fullcatalog.aspx file and add Trace=”true” to the page directives.
Figure 1, Using ASP.NET Tracing (Trace=“True“)
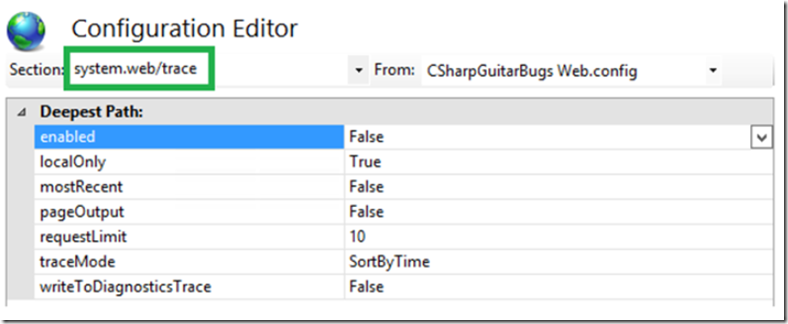
- You can also turn on Tracing at the Application level so that every ASPX page has the performance report.
Figure 2, Using ASP.NET Tracing (Trace=“True“)
- Access the page again and scroll to the bottom. Where is the code executing? This information is valuable for the developer team so they can look at that method to see why it is taking so long.
Figure 3, Using ASP.NET Tracing (Trace=“True“)
- Open the FullCatalog.aspx.cs file and look at the method, what is the problem?
Lab 10-2
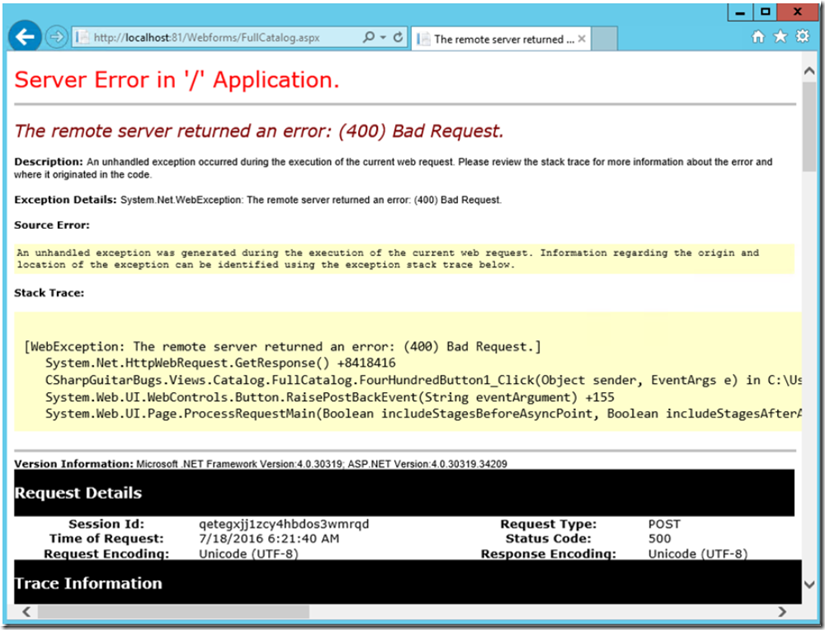
- Click the Refresh button on the FullCatalog.aspx page. If you get an error “A connection attempt failed because the connected party…” the open the FullCatalog.aspx.cs file and set the URL of the HttpWebRequest to direct to the LOCALHOST:PORT for your server.
- If you cannot get the change to apply, check our Lab 28 and deleted the Temporary ASP.NET files.
- Press the Refresh button, if the Trace=”true” is not already added to the FullCatalog.aspx page, then please add it as per Lab 10-1.
- Scroll to the bottom and find the useful piece of information.
Figure 4, Using ASP.NET Tracing (Trace=“True“)
Figure 5, Using ASP.NET Tracing (Trace=“True“)
- Look at that method in the FullCatalog.aspx.cs code and find what the problem is.
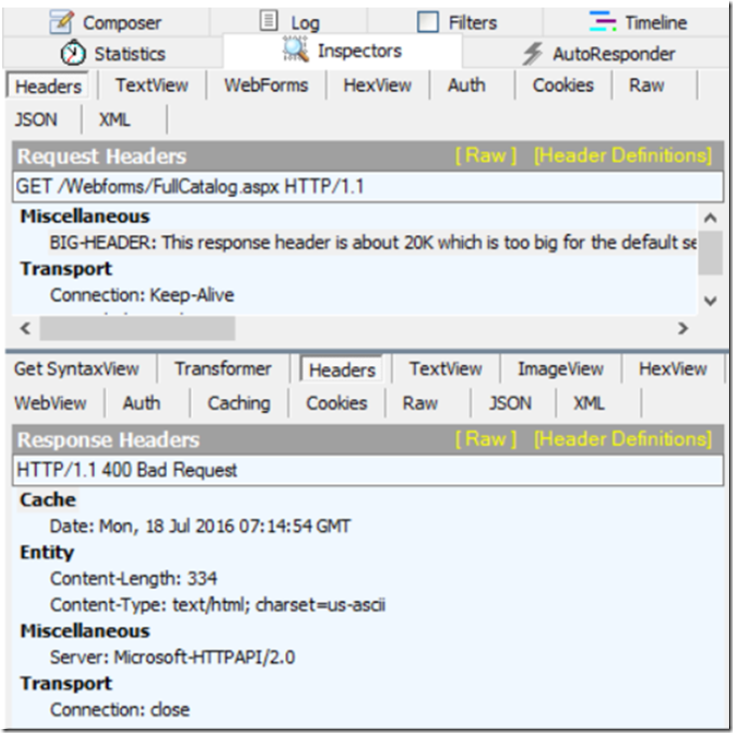
- If you know how to use Fiddler, you can check and see a little more about what is happening.
Figure 6, Using ASP.NET Tracing (Trace=“True“)
Figure 7, Using ASP.NET Tracing (Trace=“True“)
TIP: To find the size of a request header, you can copy the contents of the Request Header seen in Fiddler into a Notepad, then save it. Right-click on the txt file and view the properties.
- Recommend to the developer of the code to place the HttpWebRequest into a try{}catch{} block and write the exception to the page instead of letting it crash.
- What is the issue? Yes, the request header is too big. You will need to adjust the MaxFieldLength and MaxRequestBytes as described in more detail here. Also, as per Lab 6 when you make a change to the registry you must restart HTTP. Remember that NET STOP HTTP stops W3SVC but NET START HTTP does not start W3SVC, so you will need to also run NET START W3SVC for the web site to respond after running a NET STOP HTTP.
Figure 8, Using ASP.NET Tracing (Trace=“True“)
- Try to reproduce the issue again and it no longer happens.


