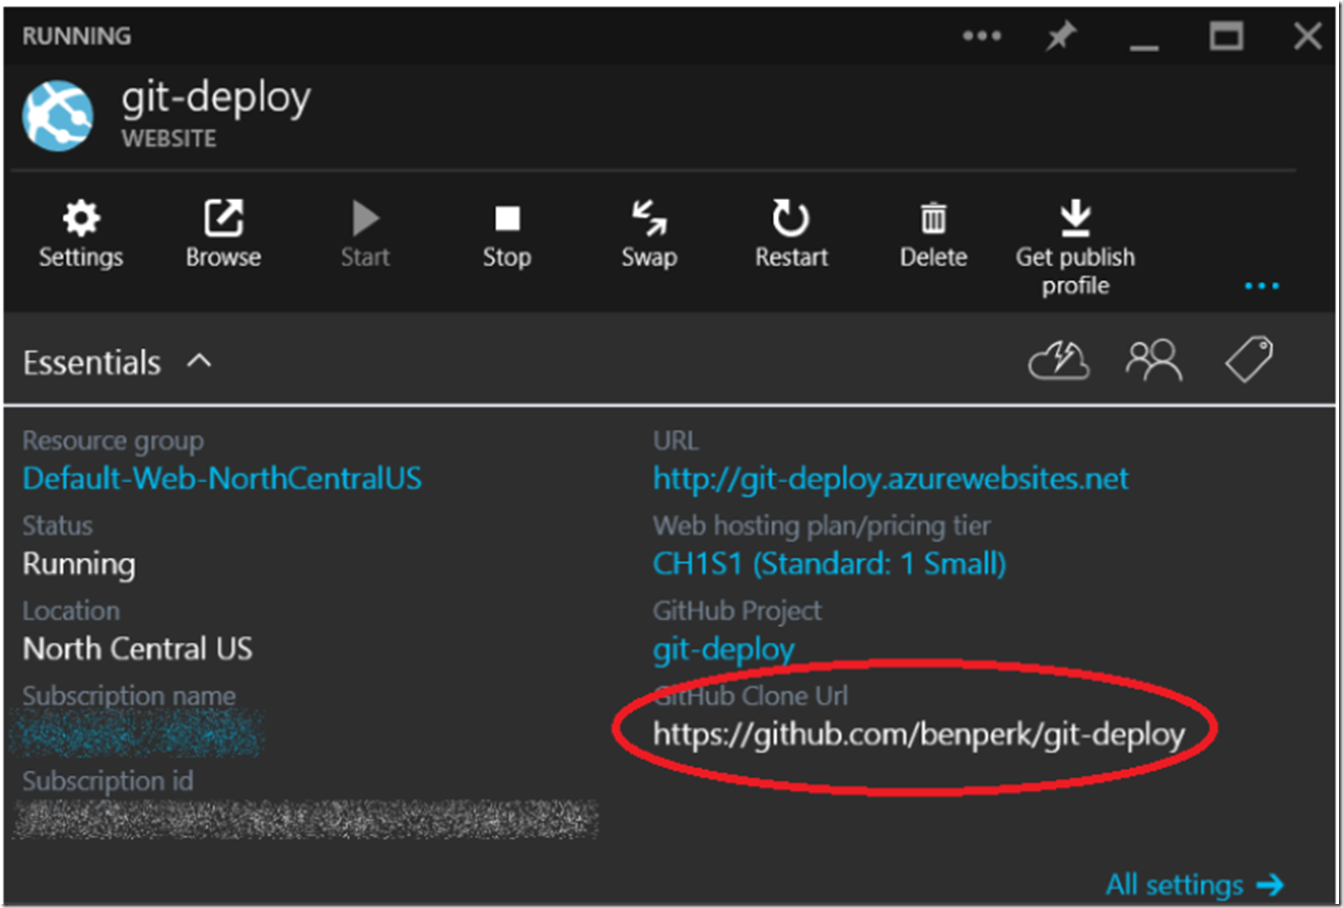
I setup a Web App to test deployments from GitHub. Once the Web App was created I linked it to GitHub by selecting the “Integrate source control” link on the main page of for the website and selected GitHub. Following the wizard I was able to make the link between the 2. The details are shown in Figure 1.
Figure 1, linking GitHub to a Web App
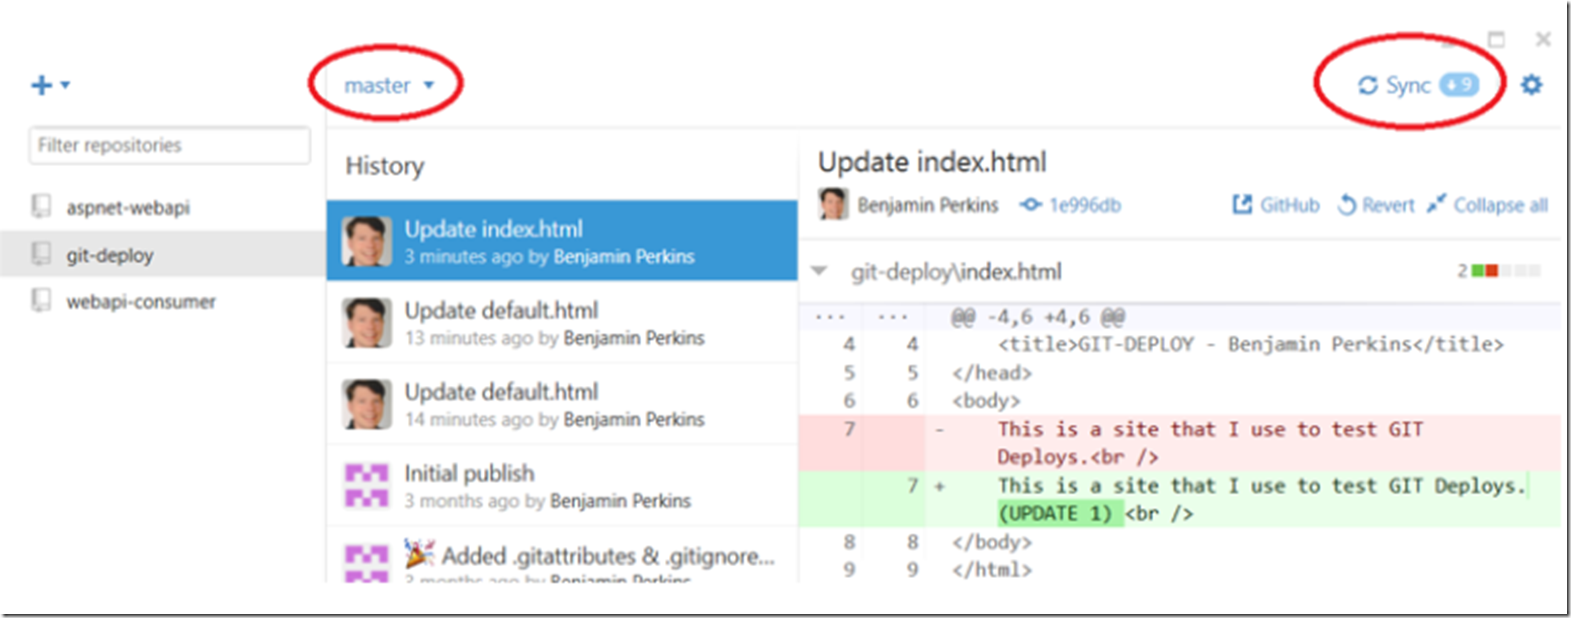
After making some changes to the MASTER branch via the online GitHub, the files are deployed to the linked Web App after comitting the changes. Additionally, after synching the files to my local repository via the GitHub Windows client application, I get a summary of the changes as shown in Figure 2.
Figure 2, GitHub client status summary
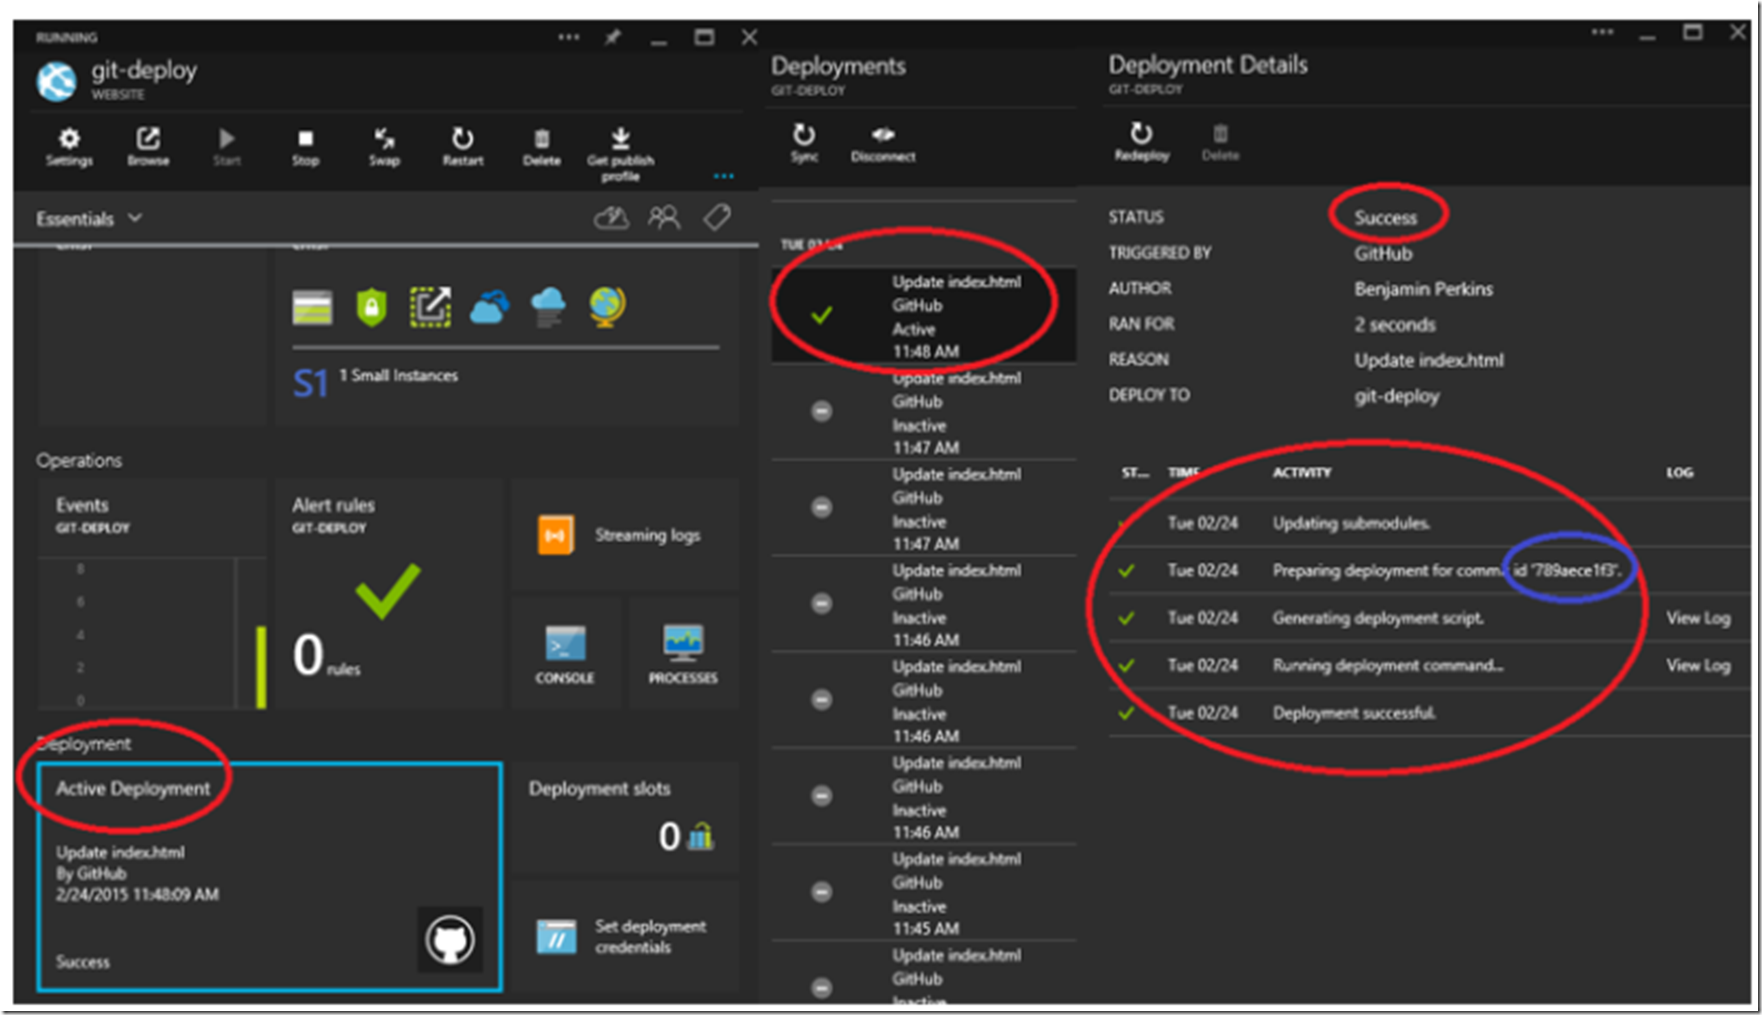
There are some useful logs in the Azure portal for checking the status of the deployment as well, as shown in Figure 3.
Figure 3, checking a Web App deployment status via the portal
However, what happens if you experience some errors during the deployment and you cannot find any issues or error messages within the portal or on the deployment repository side? The remainder of this article describes some ideas on how to proceed with your research and hopefully resolve the deployment issue. The options include:
- Review the IIS logs for errors, confirm your deployment is making a connection
- Make sure everything works outside of KUDU and Web Apps
- Diagnostic dump via KUDU and review the deployment logs
- How big is your deployment?
- Deploy using the shared Publisher Role instead of the dedicated W3WP SCM process
- View the EVENTLOG.xml file for exceptions
- Kill the SCM process (possible hung file)
- Real-time log stream analysis with CURL
A recommendation I can make quickly, is to increase your SCM_TRACE_LEVEL so that you get more details about the deployment as described here. As always, once you complete your troubleshooting, lower it back down so less data is logged, based on your requirements.
Review the IIS logs
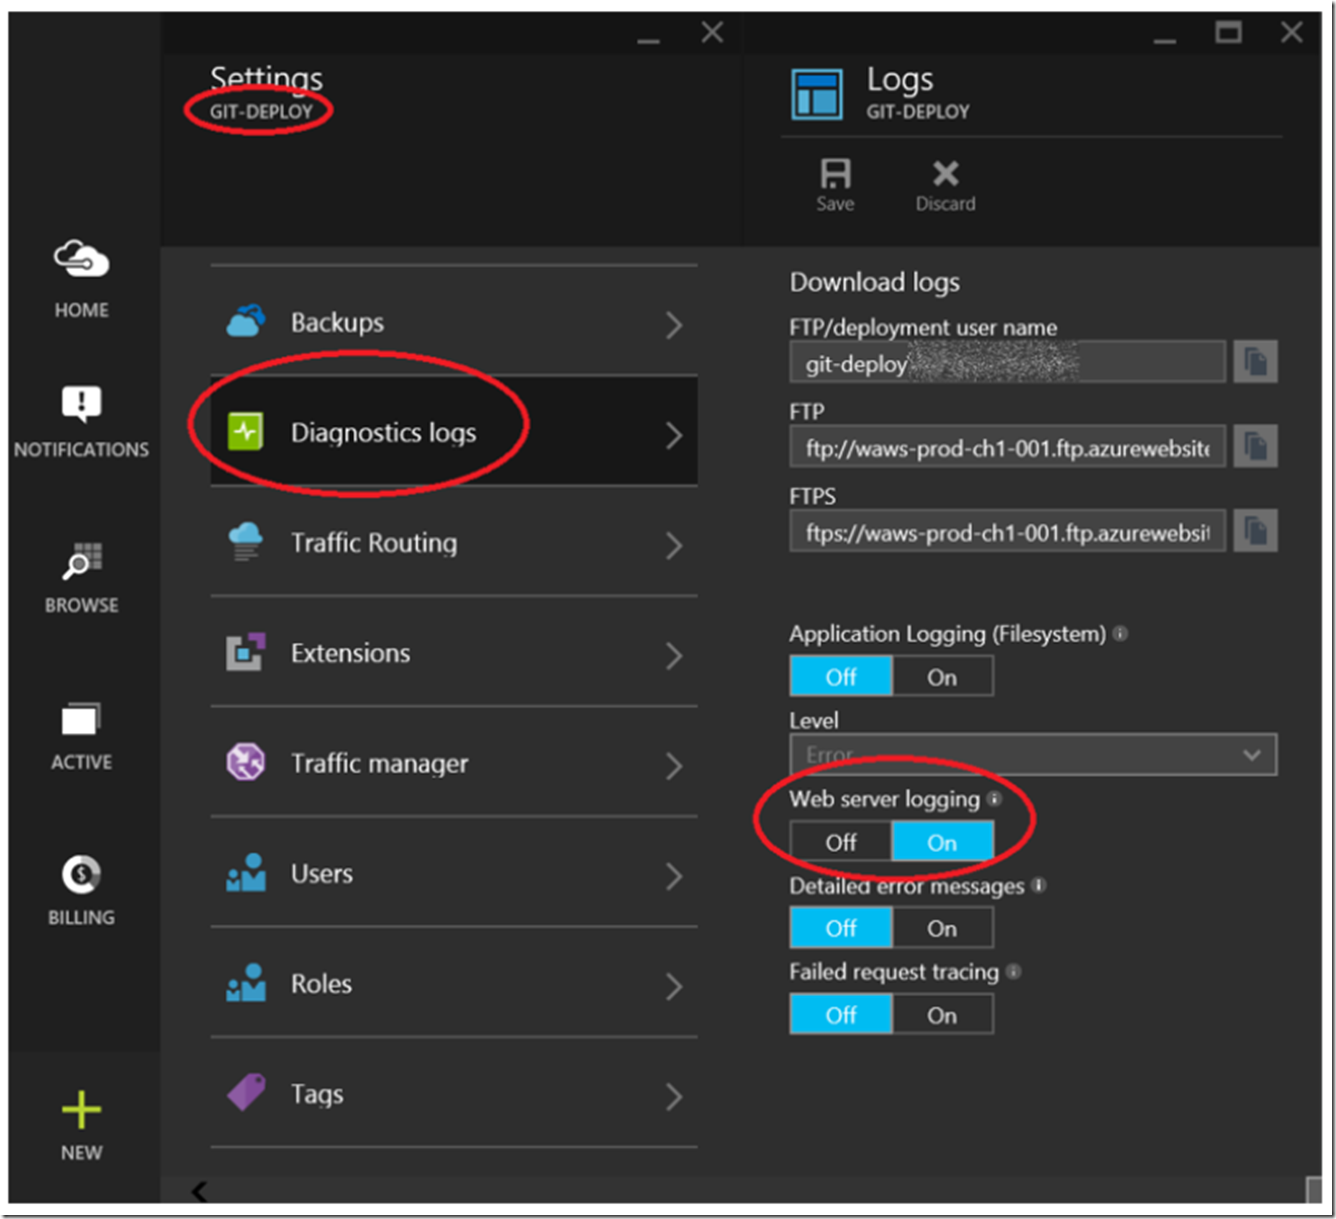
After making sure I had enabled IIS logging for my website that uses GIT, as shown in Figure 4, where Web server logging is On, I can download and analyze the logs using, for example LogParser. I wrote another article which explains how to use LogParser here.
Figure 4, how to enable IIS logs on Web Apps
As shown later in Figure 9, once enabled, the Web App IIS logs are written to the LogFiles\http\RawLogs directory. An example of a LogParser query is shown in Figure 5.
Figure 5, IIS Web App GIT deployment logs
What you would look for is, #1, do you see any POST or GET requests being sent to your Web App? If not, then your deployment is failing before it even gets to the Web App platform. You should check your network connection and specifically check if you have a proxy or firewall which is blocking the connection for some reason. #2, check the sc-status just make sure that you are getting a 200, if not, identify what the status code and sub-status code is and take appropriate actions.
Does everything work outside of KUDU and Web Apps
The point of looking at the IIS logs, discussed previously, is to confirm that your deployment is making it to the Azure platform. Here are some links to other helpful instructions for confirming things are working as they should be outside of KUDU and Web Apps.
- Making sure things work outside of Kudu and Web Apps
- Make sure all your files are committed
- Make sure site correctly deploys locally
- Check if the MSDEPLOY, discussed here works
If everything checks out, then continue reading the article for more tips and suggestions on how to troubleshoot and analyze further.
Create an Web App Diagnostic dump
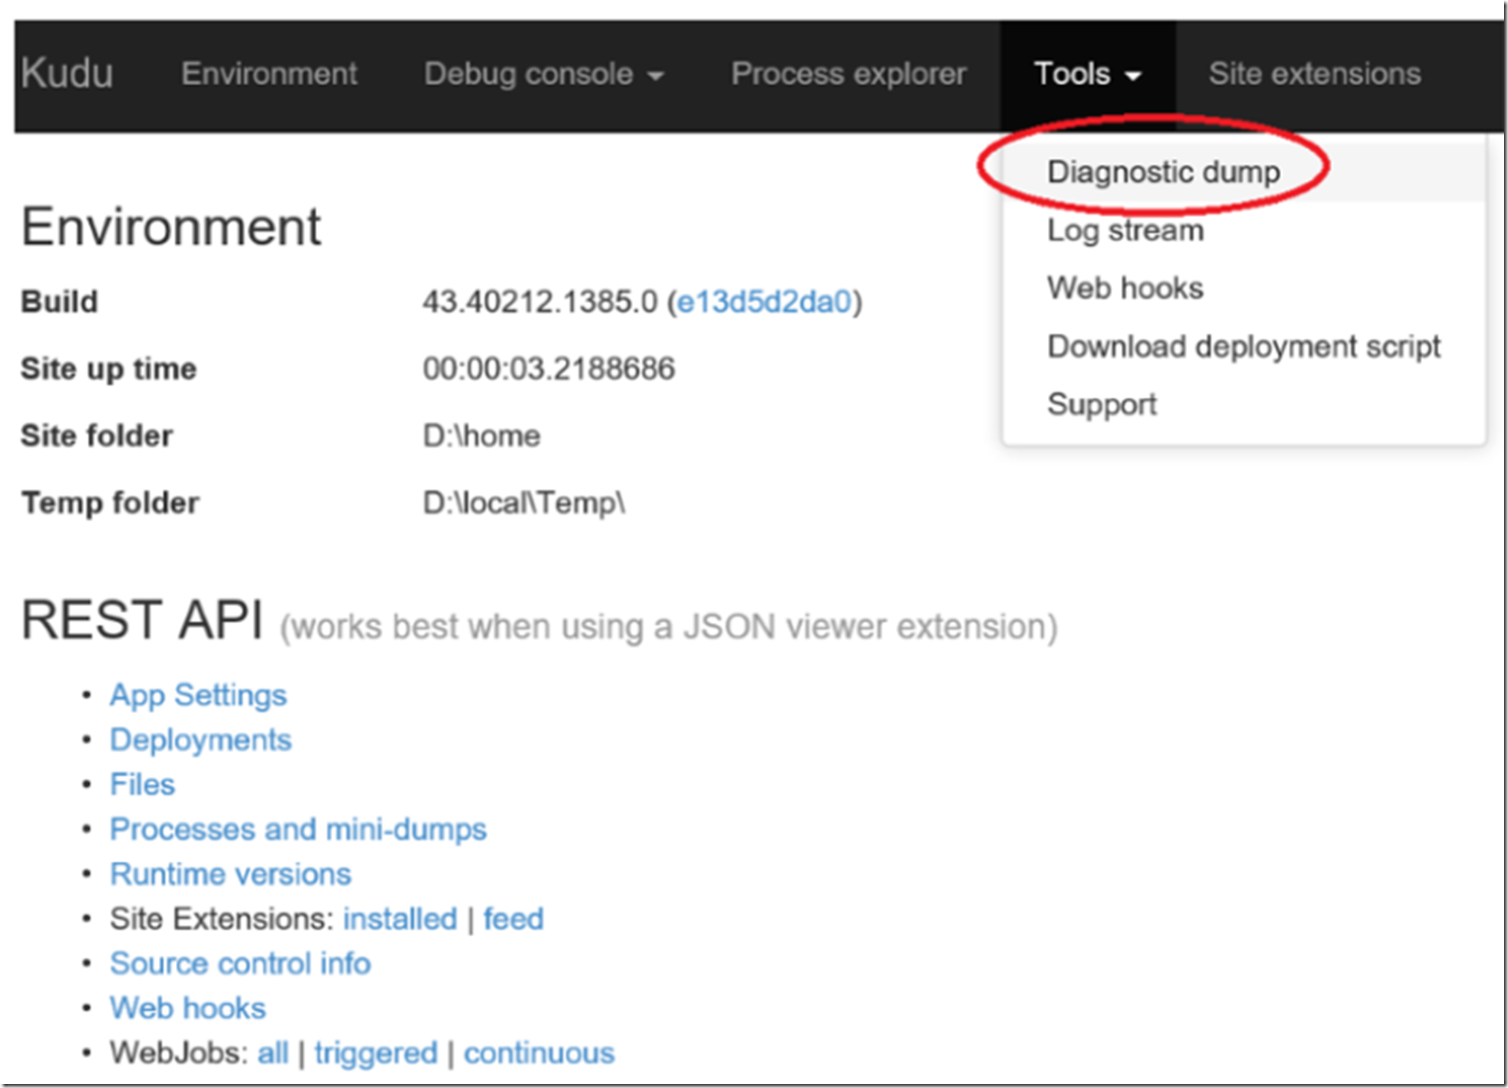
I wrote a brief article about KUDU/SCM here, explaining a little about SCM / KUDU. To download the Diagnostic dump which will include many log files for the site, including the deployment logs, click the Diagnostic dump menu item, within KUDU, as shown in Figure 6.
Figure 6, capture a Web App Diagnostic dump
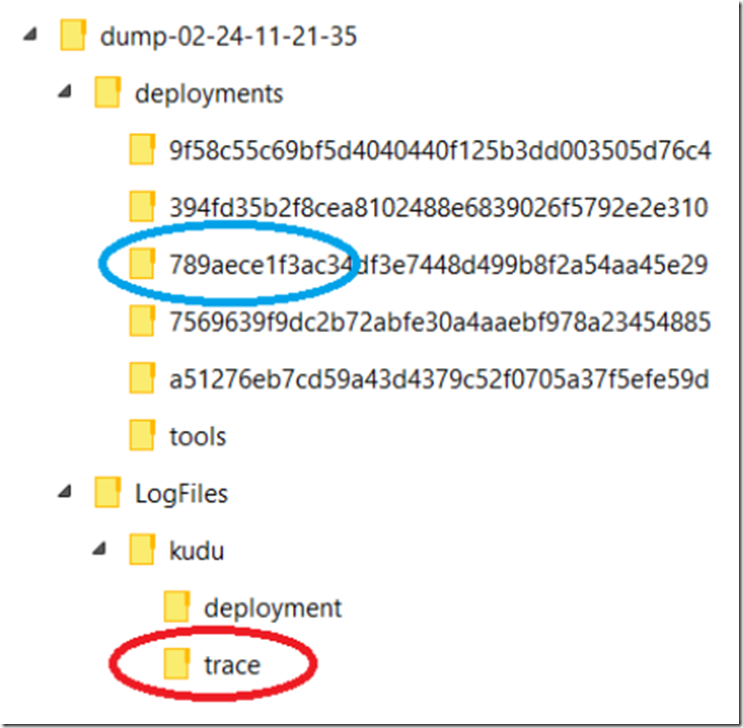
Once the process is completed, you are prompted to save or open the ZIP file. The contents of the diagnostic dump are shown via Figure 7. The deployments directory contains folders with a deployment GUID as their name, for example 789aece1f3ac34df3e7448d499b8f2a54aa45e29, each deployment will receive its own folder with a different deployment GUID. Within the deployment GUID folder, there are 2 XML files, one is the STATUS.xml file which contains information about the deployment like author, who deployed it, the start and end date, basically an overview of the deployment. Of course the status of the deployment exists as well.
Figure 7, Web App deployment logs
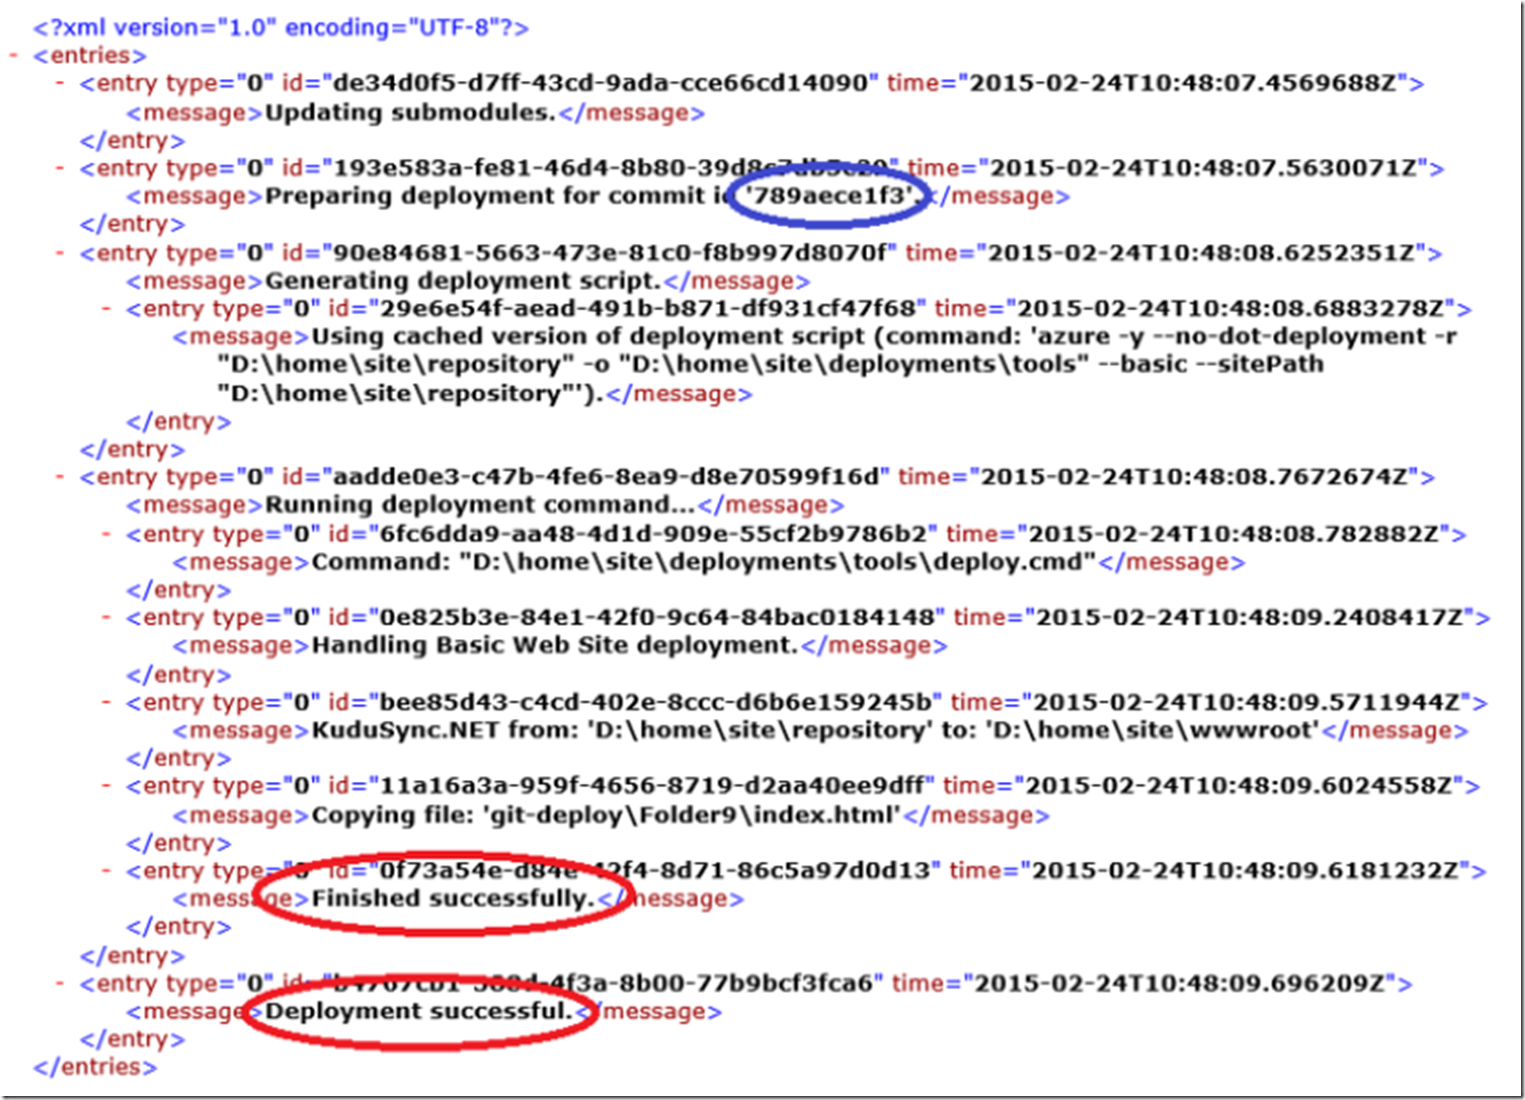
The other XML file in the deployment GUID folder is the LOG.xml file as shown in Figure 8. Notice that the deployment GUID is the same, circled in blue in many locations, see Figure 3, Figure 7 and Figure 8, all circled in blue. The LOG.xml provides more details about the deployment and may include errors or exceptions that lead to a solution.
Figure 8, a successful deployment log file
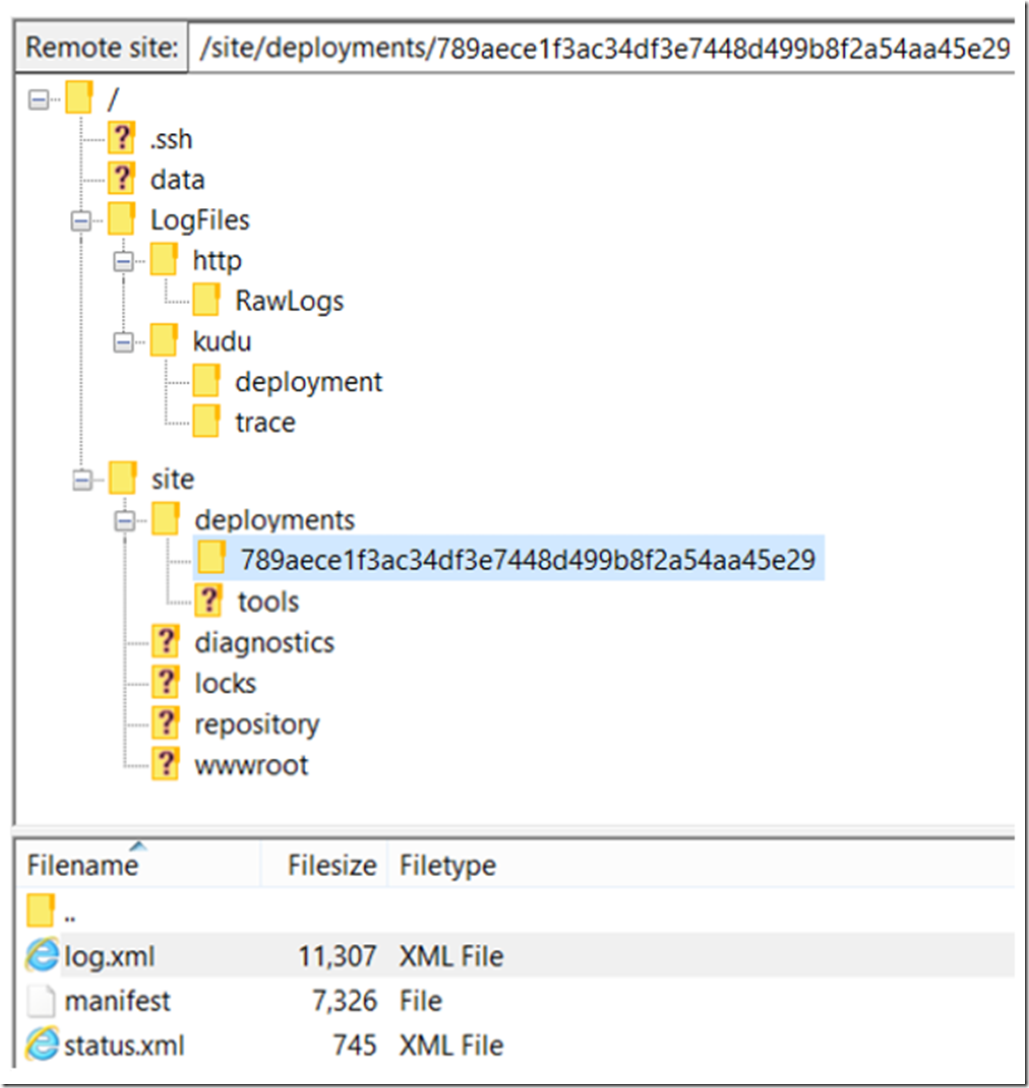
Additionally, you’ll find the deployment log, as shown in Figure 9 using FTP.
Figure 9, get the deployment log via FTP
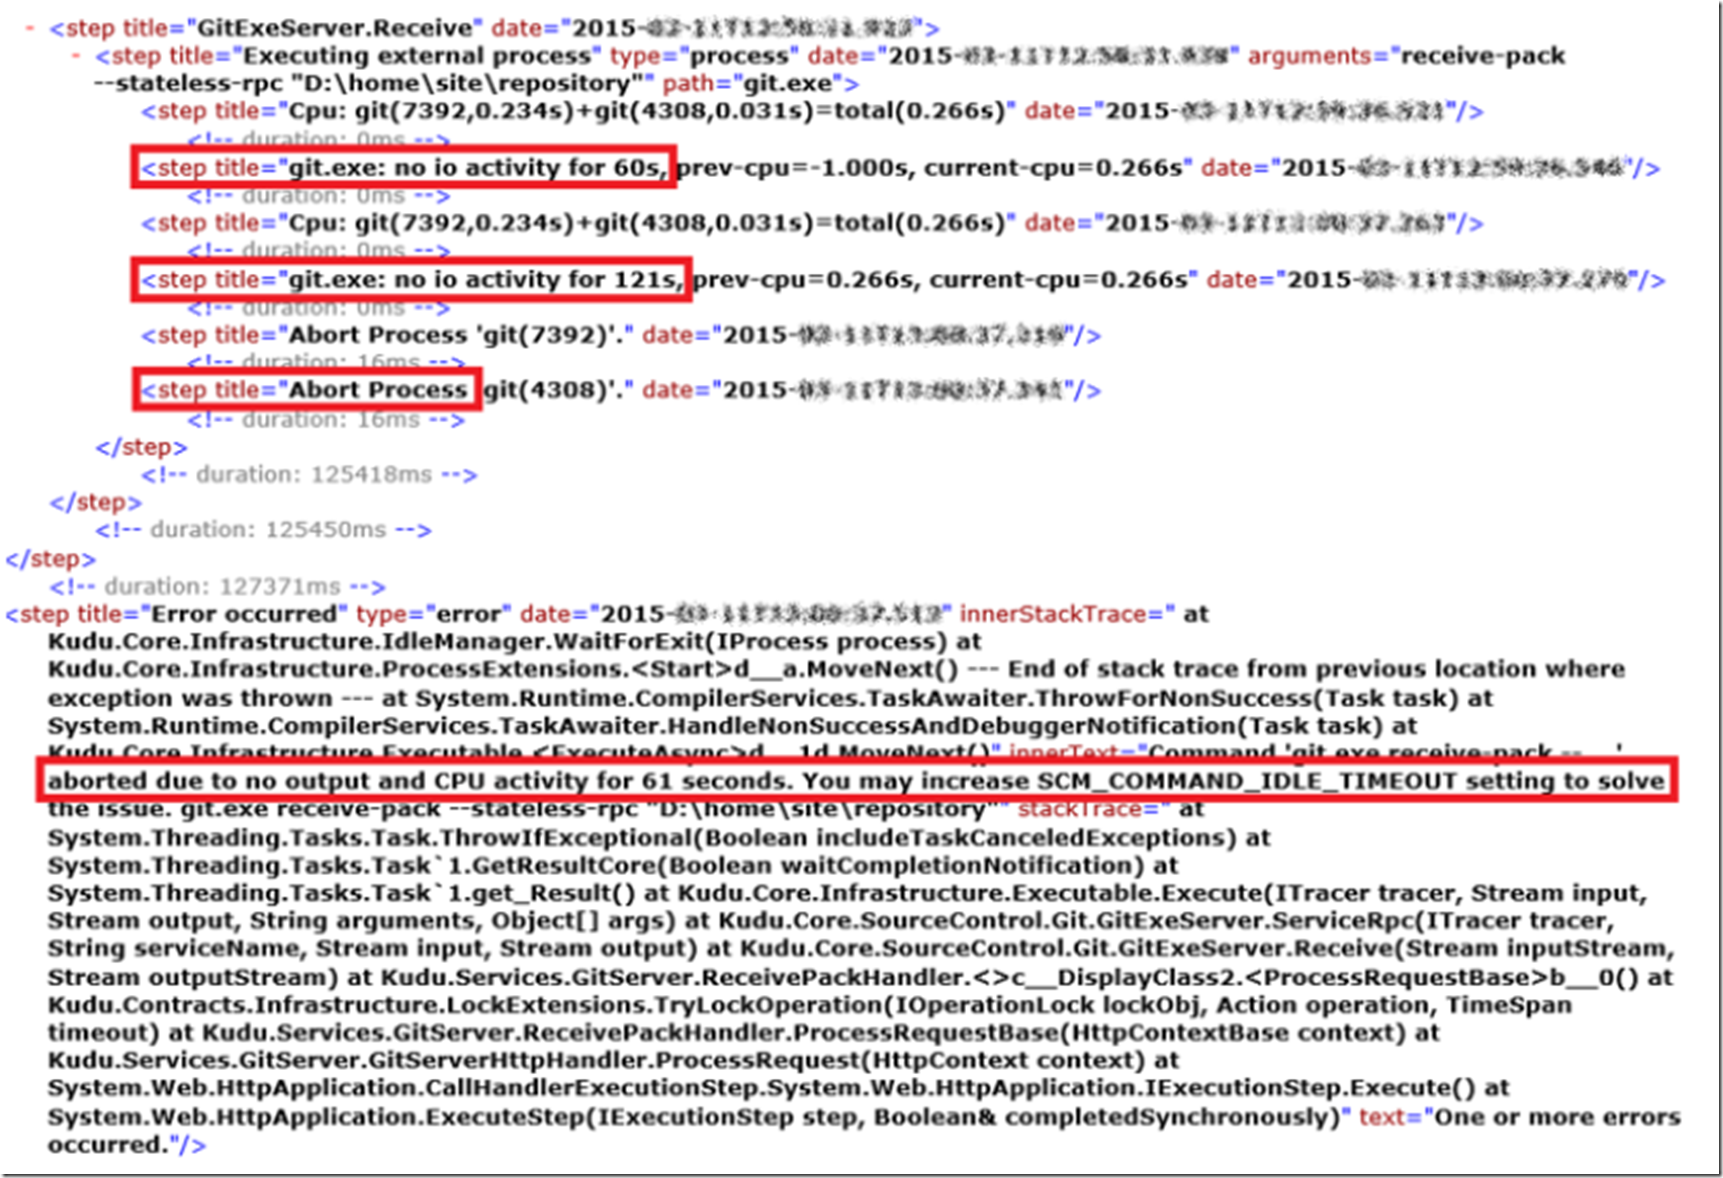
Another place to check for exceptions and errors, if you can’t find any log of your deployment in the \deployments directory, is in the LogFiles\kudu\trace directory as shown previously, circled in red in Figure 7 and also seen in Figure 9 via FTP. I recommend that you perform a search for keywords like ‘error’ or ‘exception’ then review each of the files that contain these words. For example, I found this error in a trace file, shown in Figure 10. It was very cool indeed to actually find a recommended solution with the logged exception.
Figure 10, Web App GIT deployment error
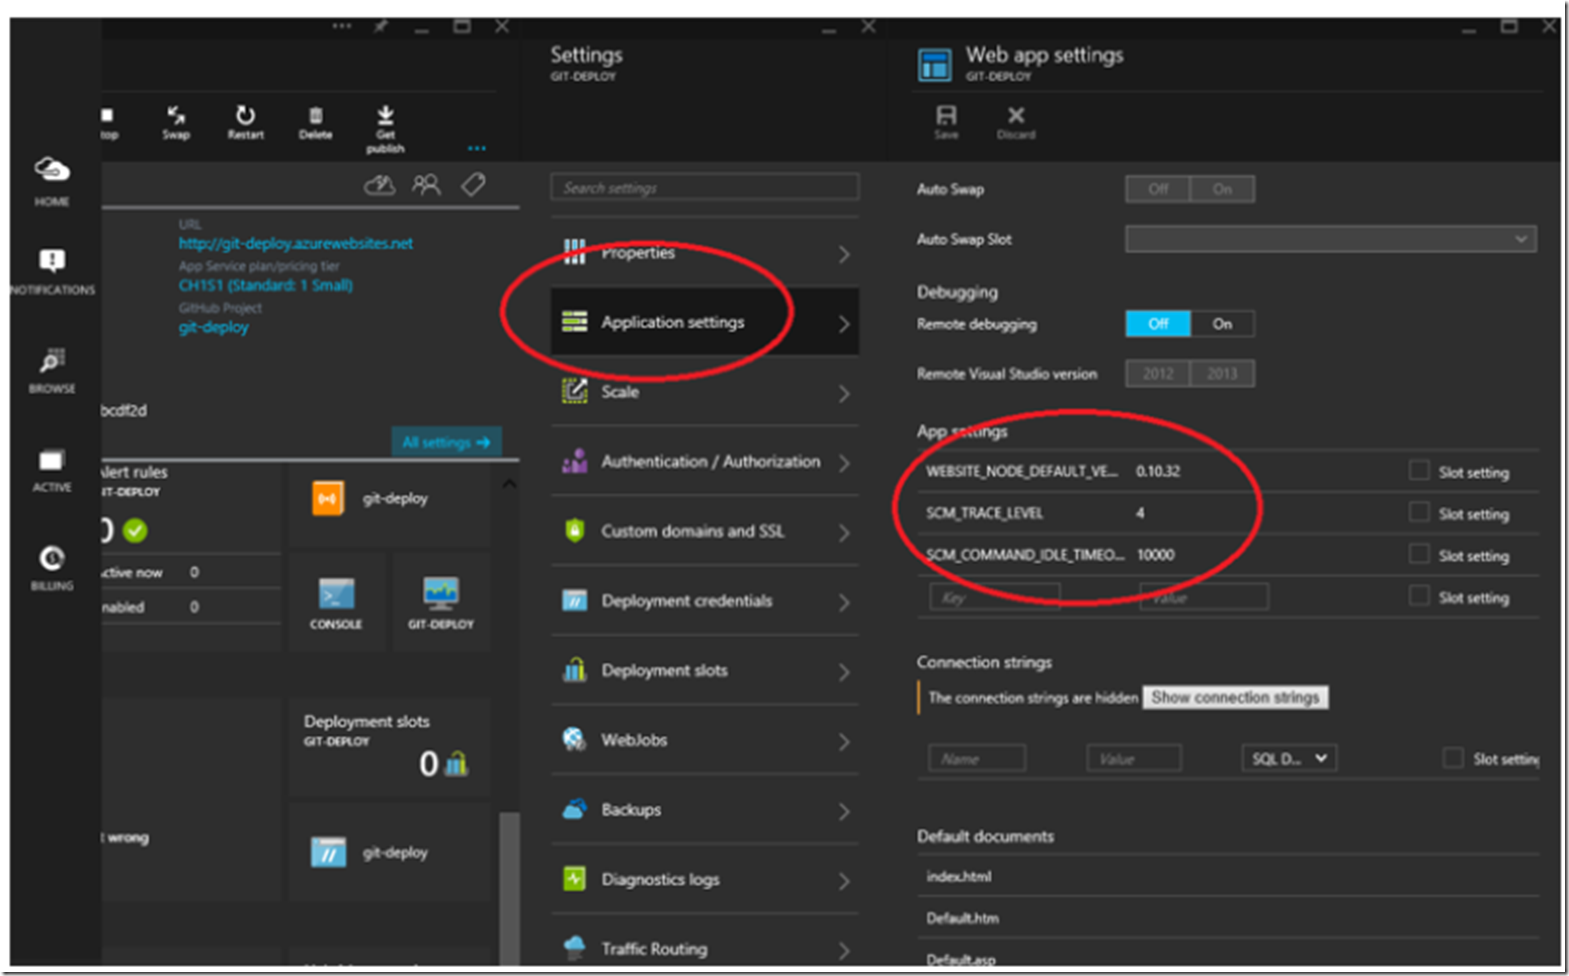
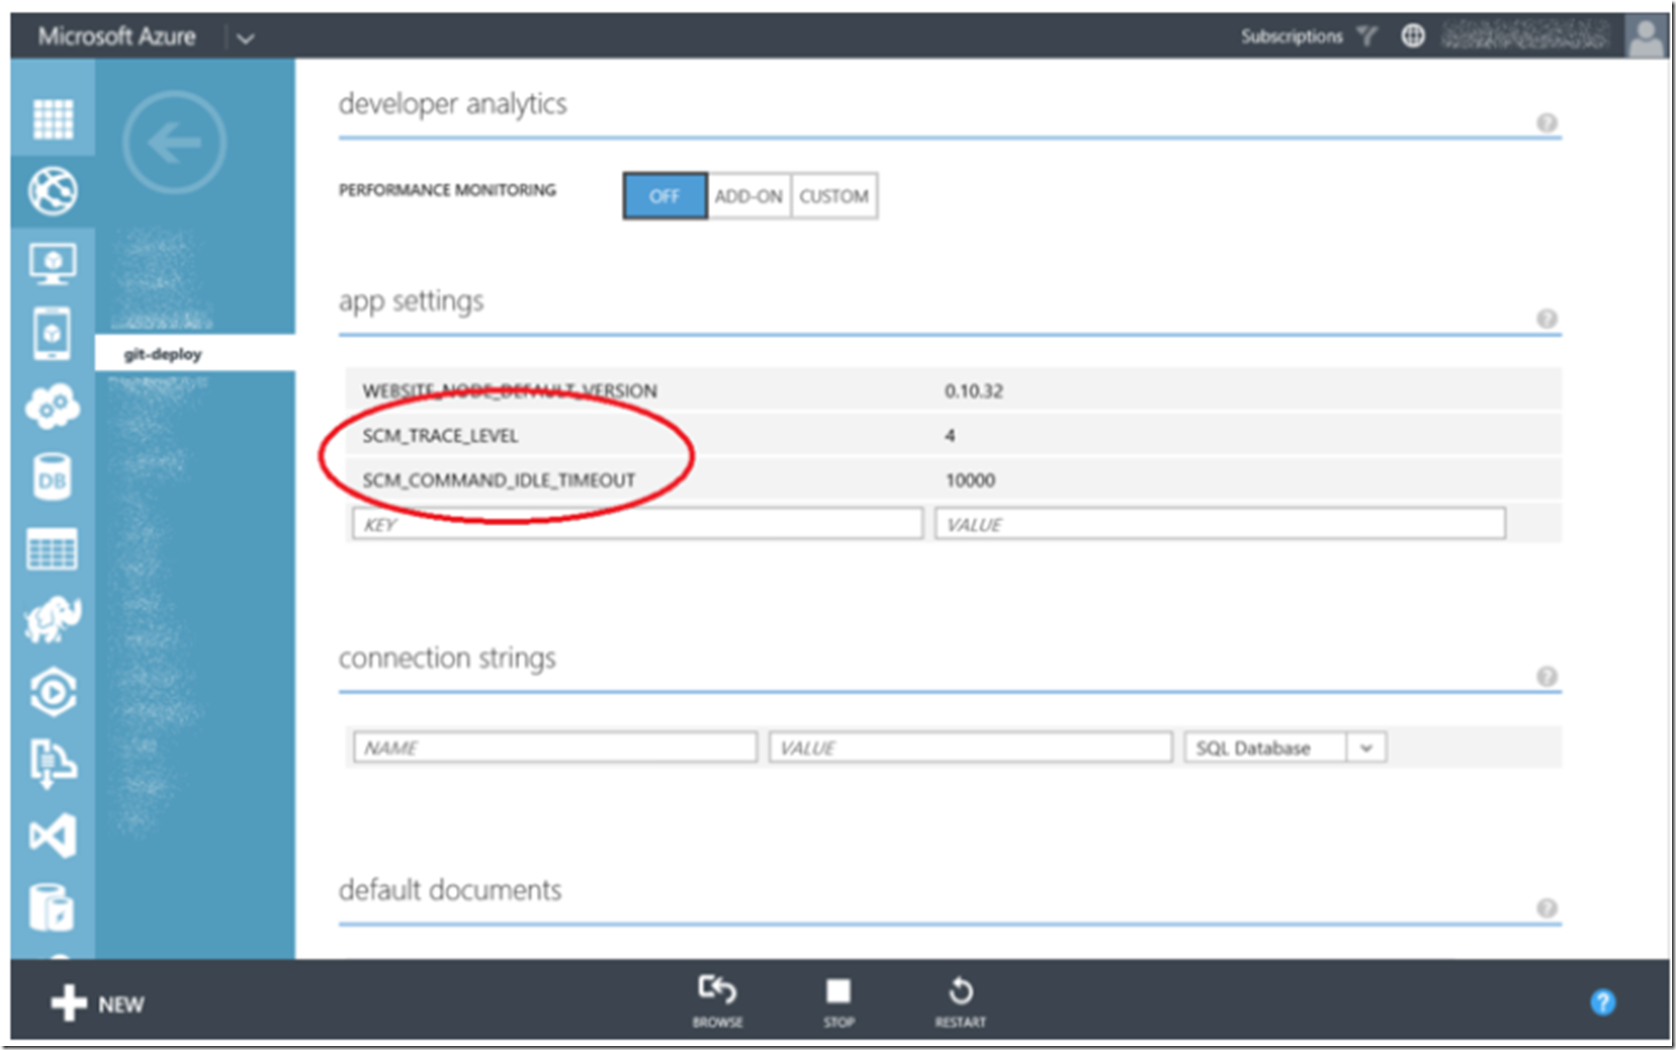
Performing a BING search for SCM_COMMAND_IDLE_TIMEOUT, lead me to this page that describes the configurable repository and deployment settings. If this happens to you, you might consider raising the timeout value over the 60 second default limit. To set these values, access the Azure portal and make the change to the Application settings for the given git linked Web App, as shown in Figure 11a (new portal) and 11b (current portal). Additionally, you can add a .deployment file to your Git repository and make the changes there. This is discussed at the end of the articles in the ‘HOW TO create a .deployment file’ section.
Figure 11a, How to change verbose logging for Web App deployments in the new preview portal
Figure 11b, How to change verbose logging for Web App deployments in the current portal
How big is your deployment?
Another valid focus point, if you get time outs or failures is the size of your deployment. Is the deployment 4 or 5 files with a total size of 20KB or is the deployment 4GB with hundreds or thousands of files? If you have a very large deployment and are getting some issues, consider increasing the http.postBuffer to a larger size, greater than the default size of 1MB. Here is a nice description of the configuration you can make to a GIT configuration. Additionally, the Web App forums is a great resource to search for other customer experiences, here is where I found the tip about increasing the http.postBuffer. Other newer or existing posts may help you find a solution.
Deploy using the shared Publisher Role
When you make a deployment to your Web App the process that accepts and executes the deployment request is the dedicated W3WP process running your SCM website. Review this article here, and you can see that the WEBSITE_WEBDEPLOY_USE_SCM app setting is set to TRUE by default. When set to TRUE, your deployment is managed through the SCM process. If you set the WEBSITE_WEBDEPLOY_USE_SCM to FALSE, then the shared Web App Publisher Role performs your deployment as shown here (expand “Overview of Web Sites Roles”).
You can give this a try, but it is recommended to use the dedicated process versus the shared one, however, in a serious situations where you need the code deployed fast, this might be an option for getting it done.
##View the EVENTLOG.xml file for exceptions
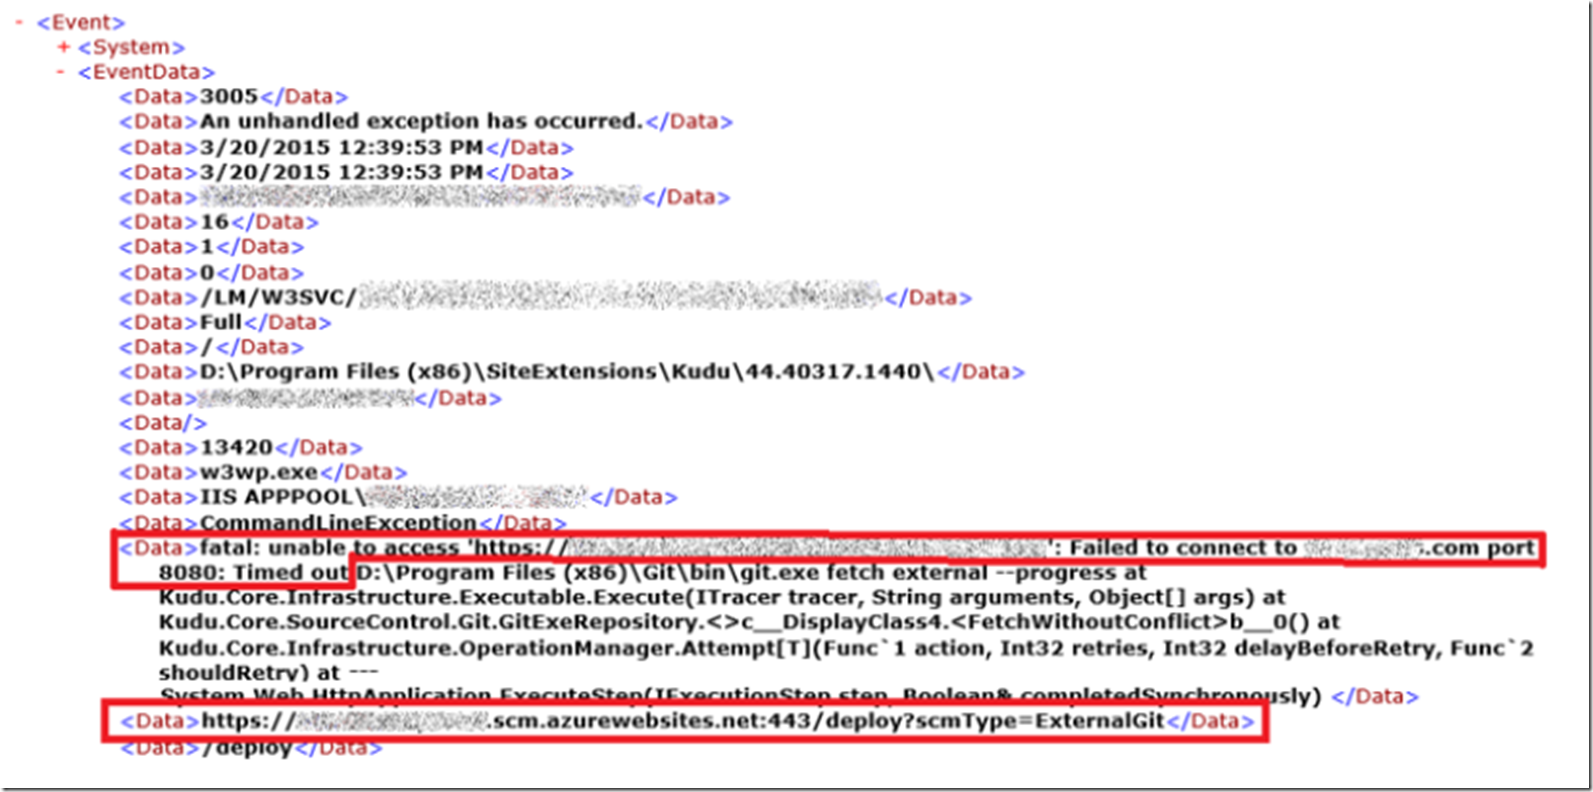
The EVENTLOG.XML which I discuss here, is a very good source of information when exceptions occur during a deployment or within your Web App in general. As seen in Figure 12, the data is in an XML format which you can search through in, for example Visual Studio, or parse it using LogPaser as previously mentioned.
Figure 12, viewing the RAW EVENTLOG.XML data of a Web App event
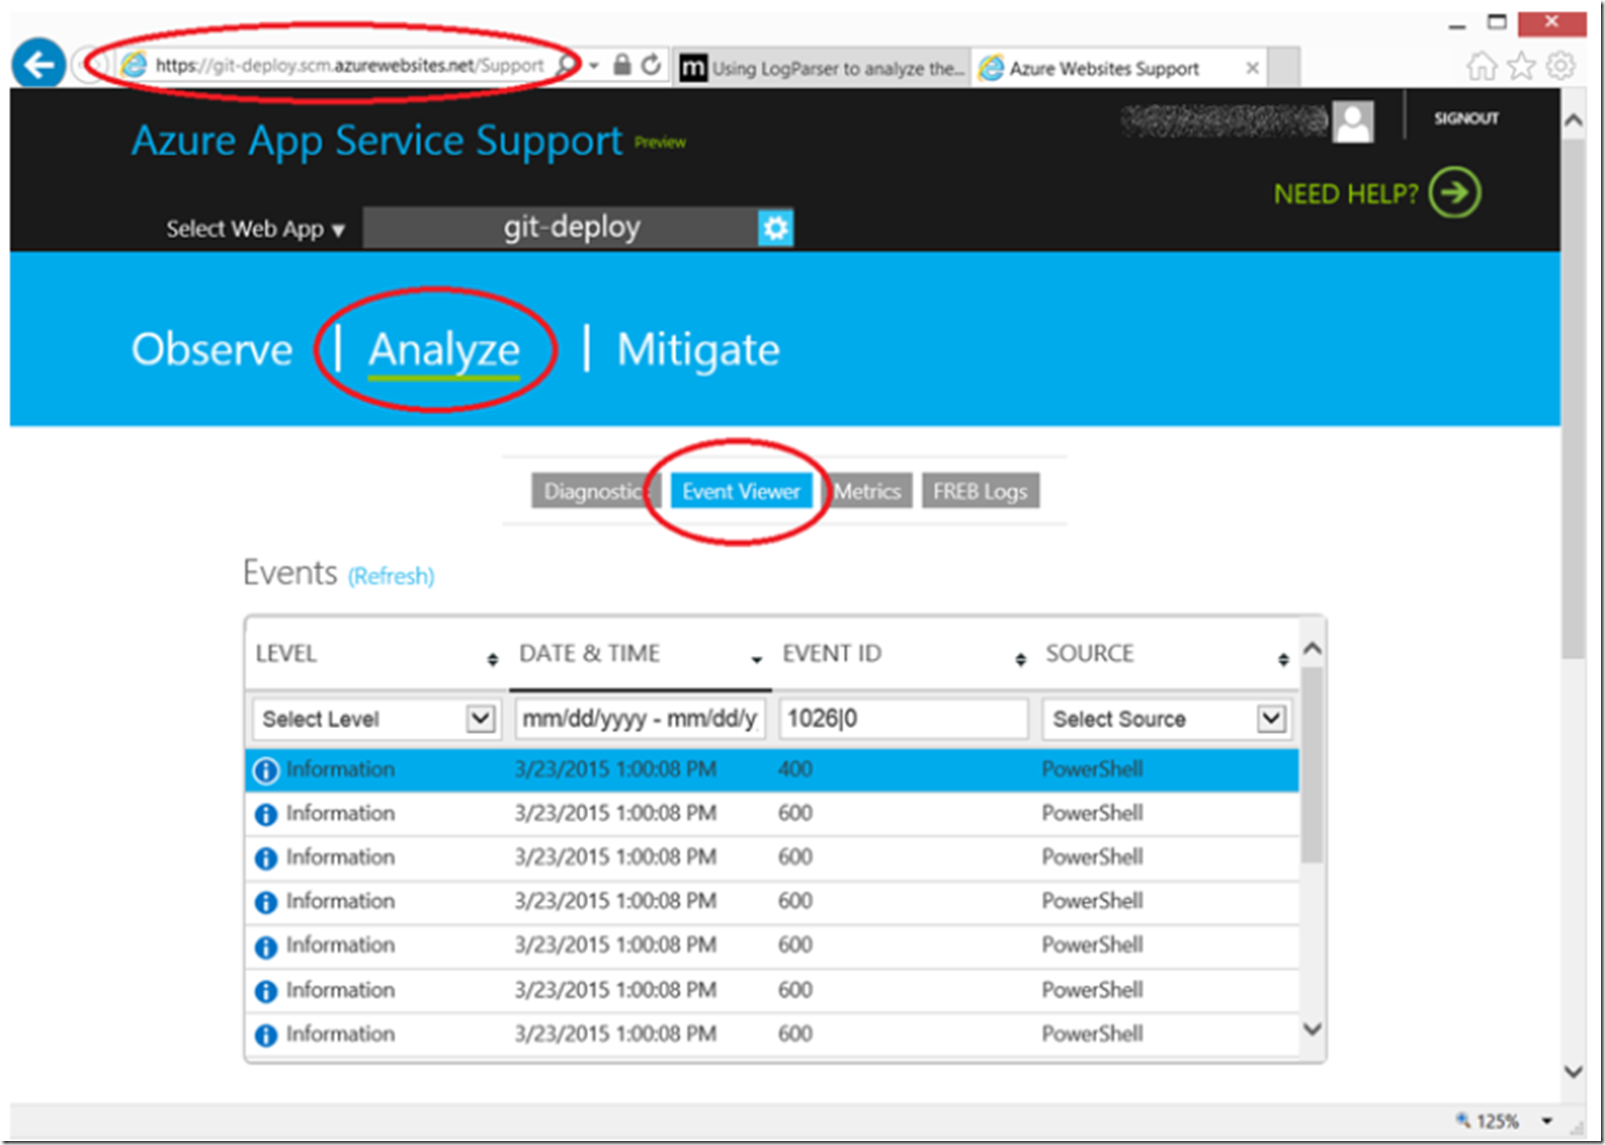
You can also access the contents of the EVENTLOG.XML file via the Event Viewer support feature via your KUDU console, as shown in Figure 13.
Figure 13, viewing event viewer logs for your Web App via KUDU
Kill the SCM process
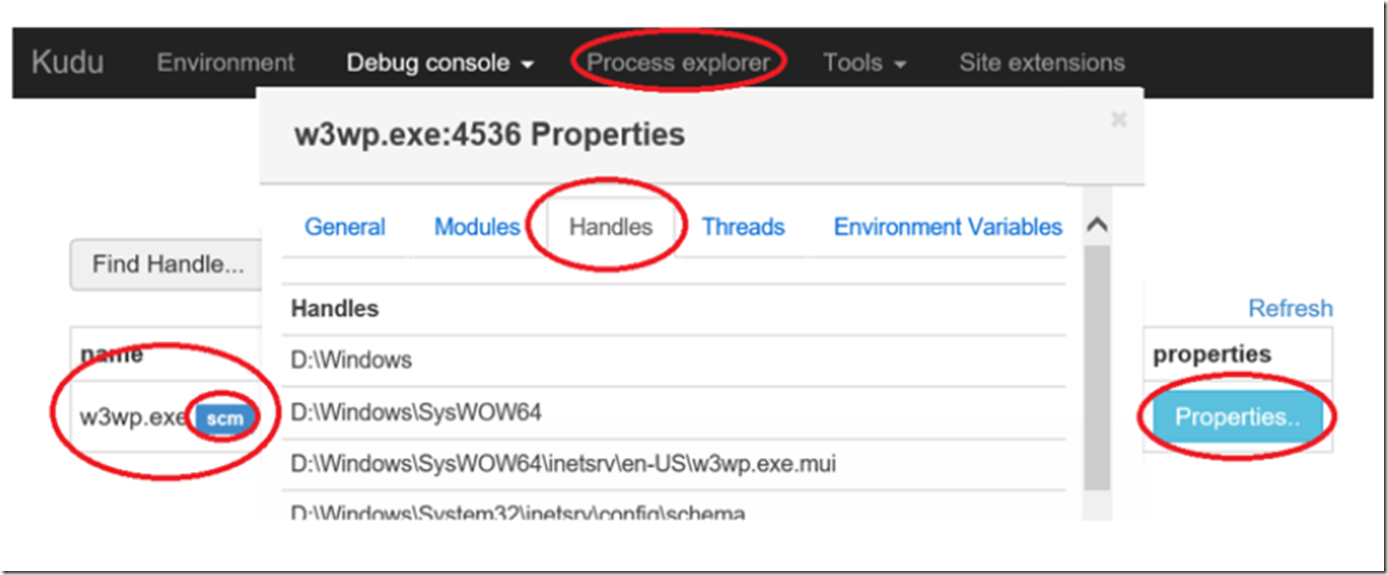
There may be a situation where a file you are trying to update is currently being used by a process running on your VM. This may cause your deployment to hang and then possibly fail. You can check this by selecting the Handle tab within the properties of the processes shown via the Process Explorer, shown in Figure 14. If you find a file you are attempting to modify in the list, then you may want to kill the W3WP SCM or W3WP process. Or, consider killing them both regardless, if there is minimal impact to your users, just to make sure you didn’t miss anything.
Figure 14, kill, kill, kill the process that is stopping my Web App deployment
The processes will be restarted again once you make a request to them.
Real time log stream analysis with CURL
Performing the deployment, then capturing and analyzing the logs is a valid way to find the reason for the deployment failure. Especially so when you need to send them to someone else for analysis. However, you can also setup a tool called CURL on your client machine and watch the logs being written as the deployment takes place. Perform the following to view the Diagnostic Log Stream as discussed in some detail here.
- Download and unzip CURL from here.
- Place the CURL executable and the .crt file from the /bin directory into a directory on your client
- Enter ‘curl – u USERNAME https://??*??.scm.azurewebsites.net/logstream -k’
- Perform a deployment and watch the logs
Download, unzip and place CURL onto your client machine
As far as I read, the official CURL comes via the source code only, which means you can compile it to get your own version of the executable. The URL I provide above is to download the EXE. The link is a wizard that walks you through some questions so you get the correct version and bit size for your needs.
Next, I opened the ZIP file and found the curl.exe and curl-ca-bundle.crt in the \bin directory. I placed them into a directory which existed in my PATH environment variable. This makes it easier to run as I can enter the command into a command prompt and the system finds it without me needing to navigate to the directory in which it exists.
Enter CURL command to start the Diagnostic Log Stream monitoring
Enter the command -> “curl -u USERNAME URL -k” where:
- USERNAME – your Web App Deployment Credential, it is not the publishing credential nor your live id used to access the Azure Management Portal. It is, for example, the USERNAME you use to access your Web App via FTP
- URL – is the URL to your SCM / KUDU site for the Web App to which you are deploying
Figure 15 represents how this might look.
Figure 15, connecting SCM / KUDU via CURL for live log streaming using Diagnostic Log Stream
After you enter the command, you are prompted for your password and then welcomed into the log-streaming service.
Perform a deployment
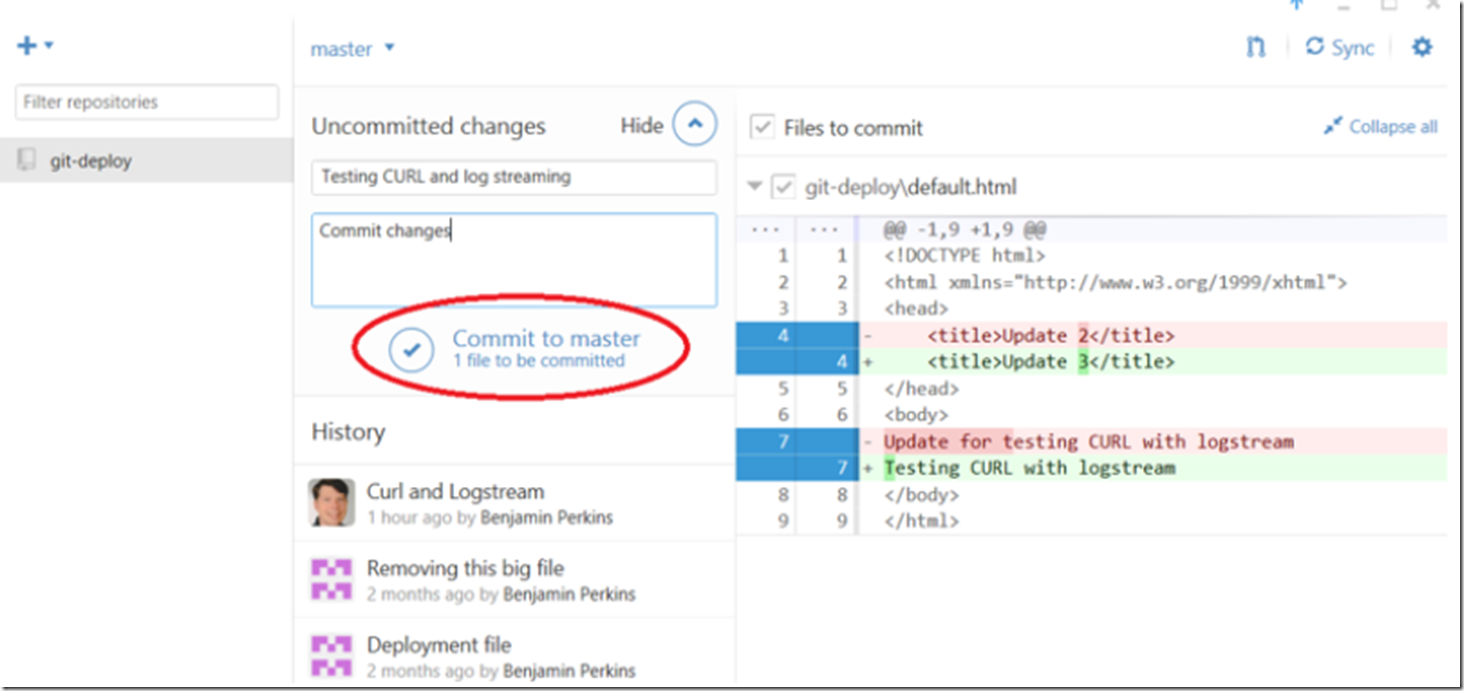
I then make a modification to a file within my local GitHub repository and commit my changes as shown in Figure 16.
Commit changes to repository for publication to a Web App
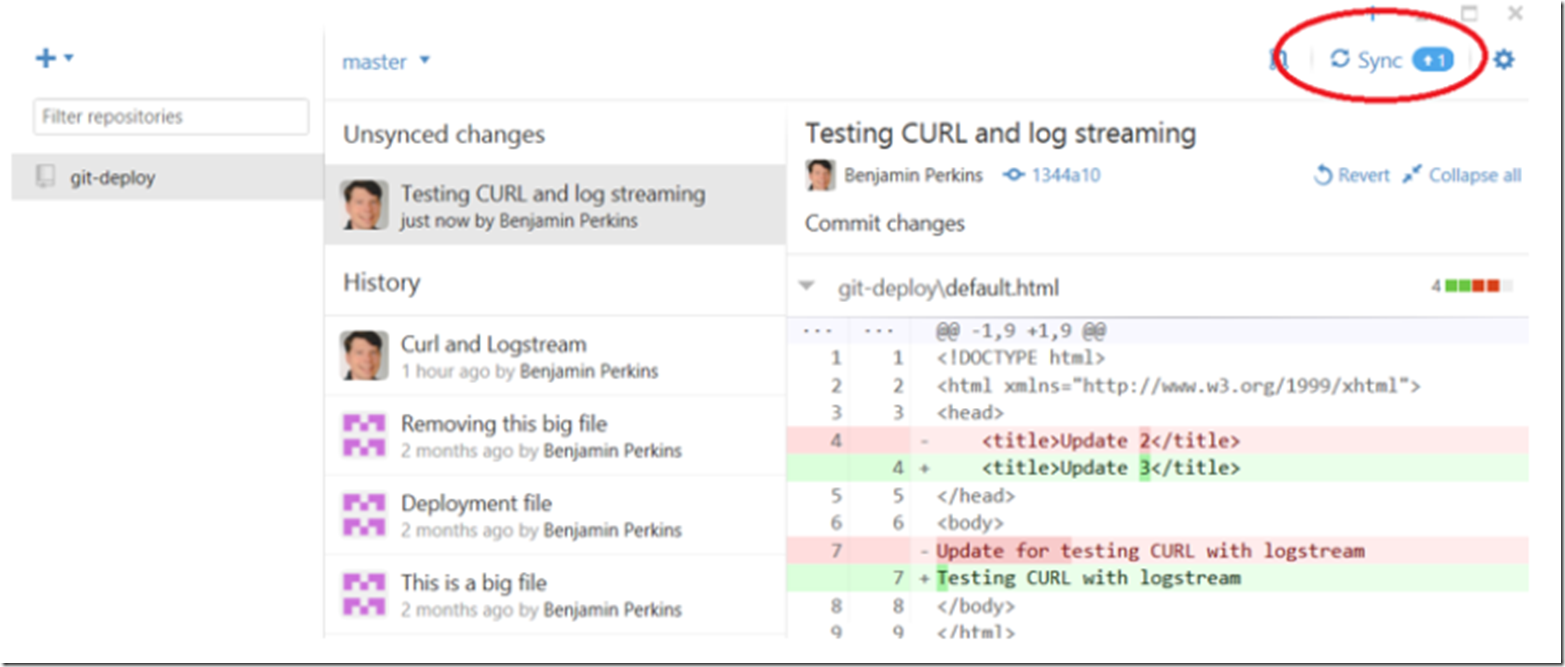
Then, synchronize the local GitHub repository with the Web App, as shown in Figure 17.
Figure 17, synchronize your local GitHub repository with your Web App
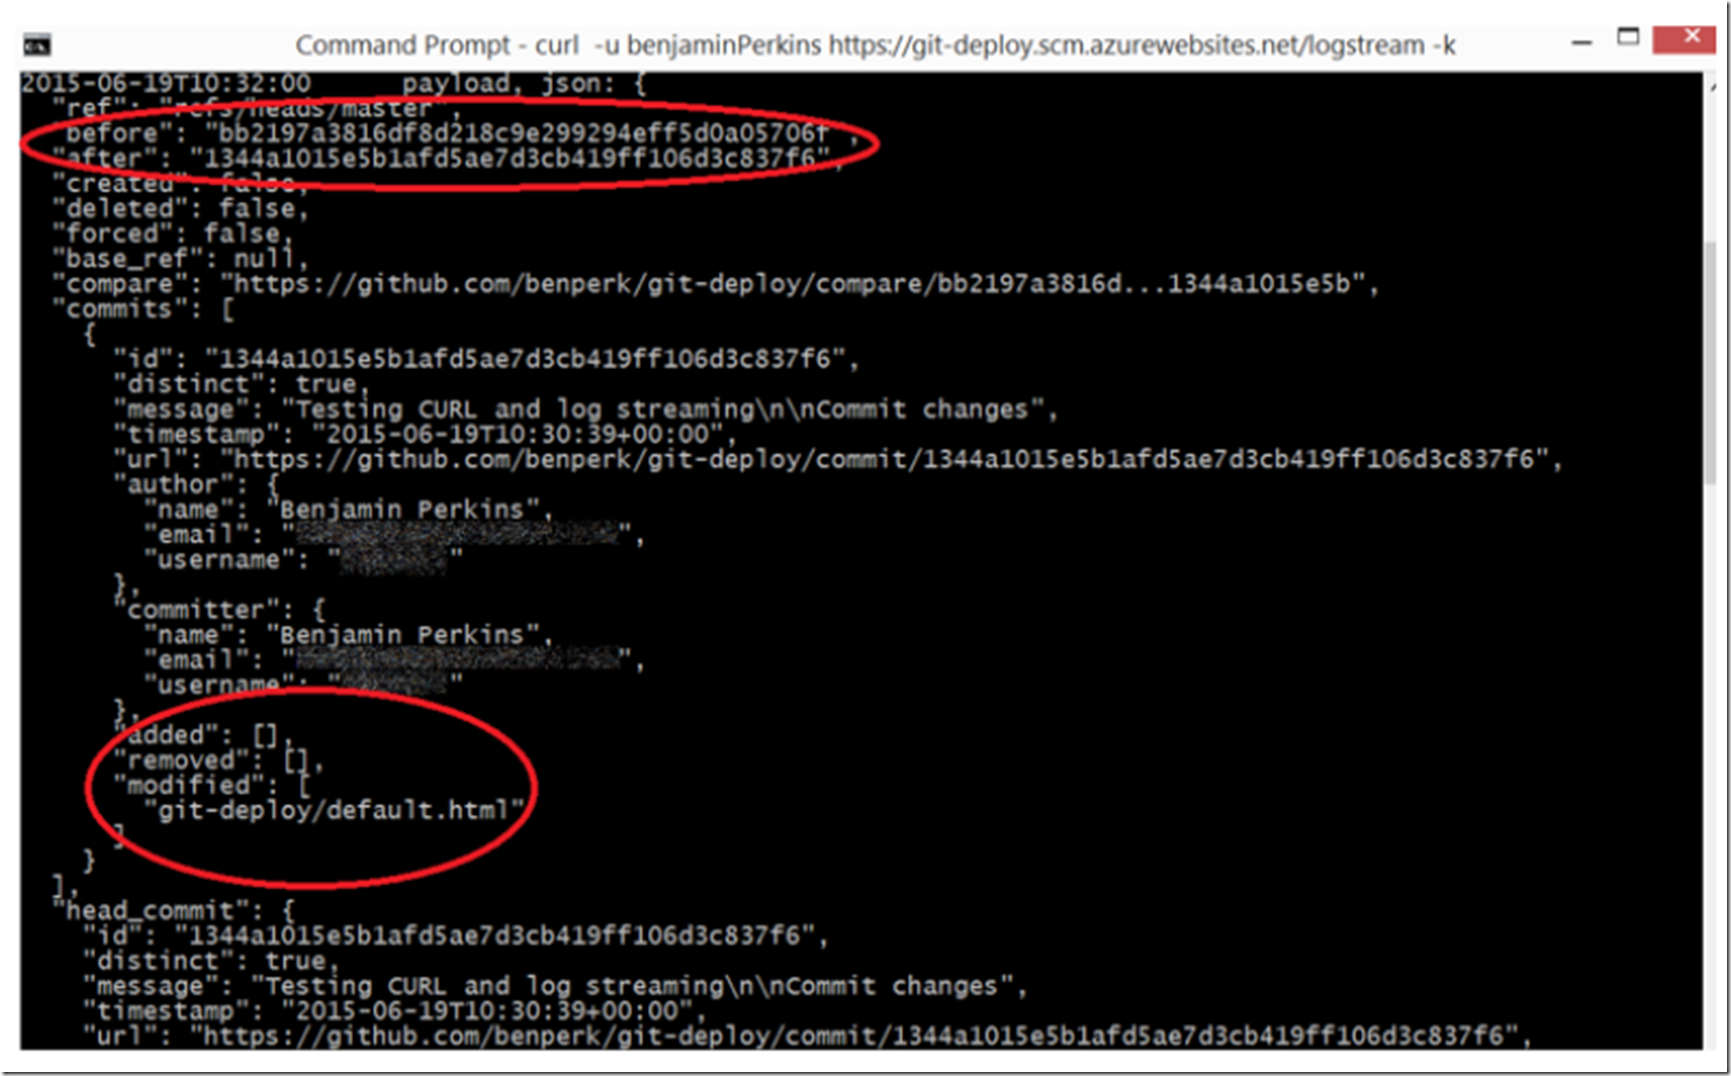
Shortly after you select the Sync button, you can watch the output of the log stream and check for any issue or exception. Figure 18 and Figure 19 illustrate a successful deployment. Notice that in Figure 18 that the before and after deployment GUIDs are displayed. This GUID is the same you would find when accessing via FTP, as seen previously in Figure 9. Additionally, you can check which files have been added, removed and modified.
Figure 18, checking the log stream for deployments to a Web App via a code repository
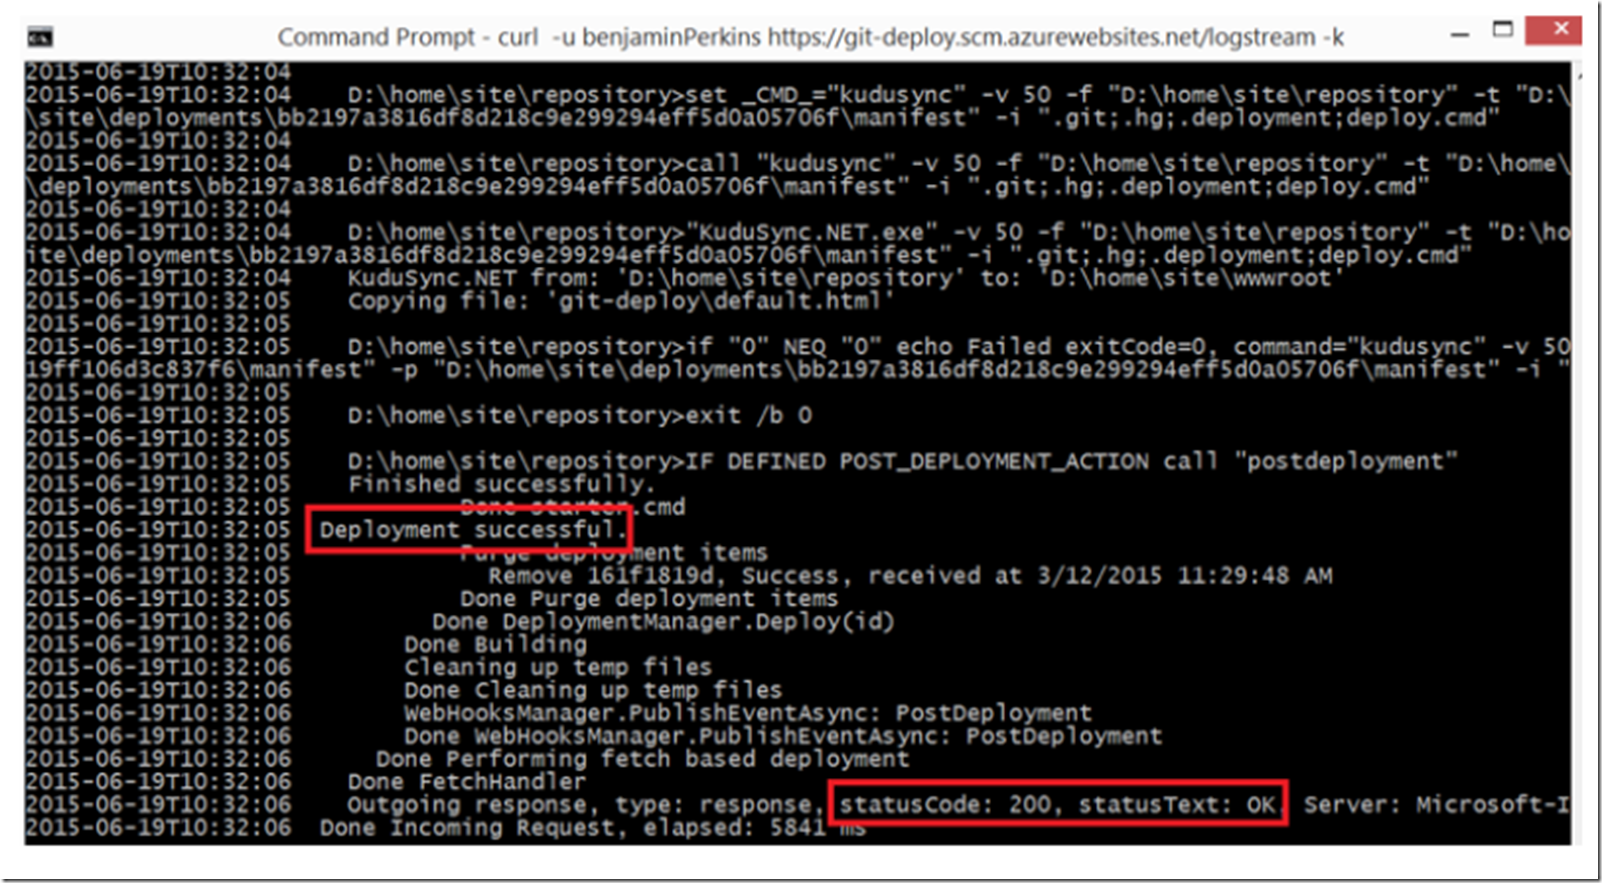
Continue watching the log stream until the end of the deployment, looking for terms such as ‘Deployment successful’ or ‘statusCode: 200, statusText: OK’, similar to that here.
Figure 19, a successful deployment to a Web App using a source code repository and CURL
If all goes well, you are done, however, if you see some exceptions or reports of ‘error’, ‘failure’, ‘statusCode’ not equal to 200, then at a minimum, you have something to begin your troubleshooting efforts and/or to provide to a support contact.
HOW TO create a .deployment file
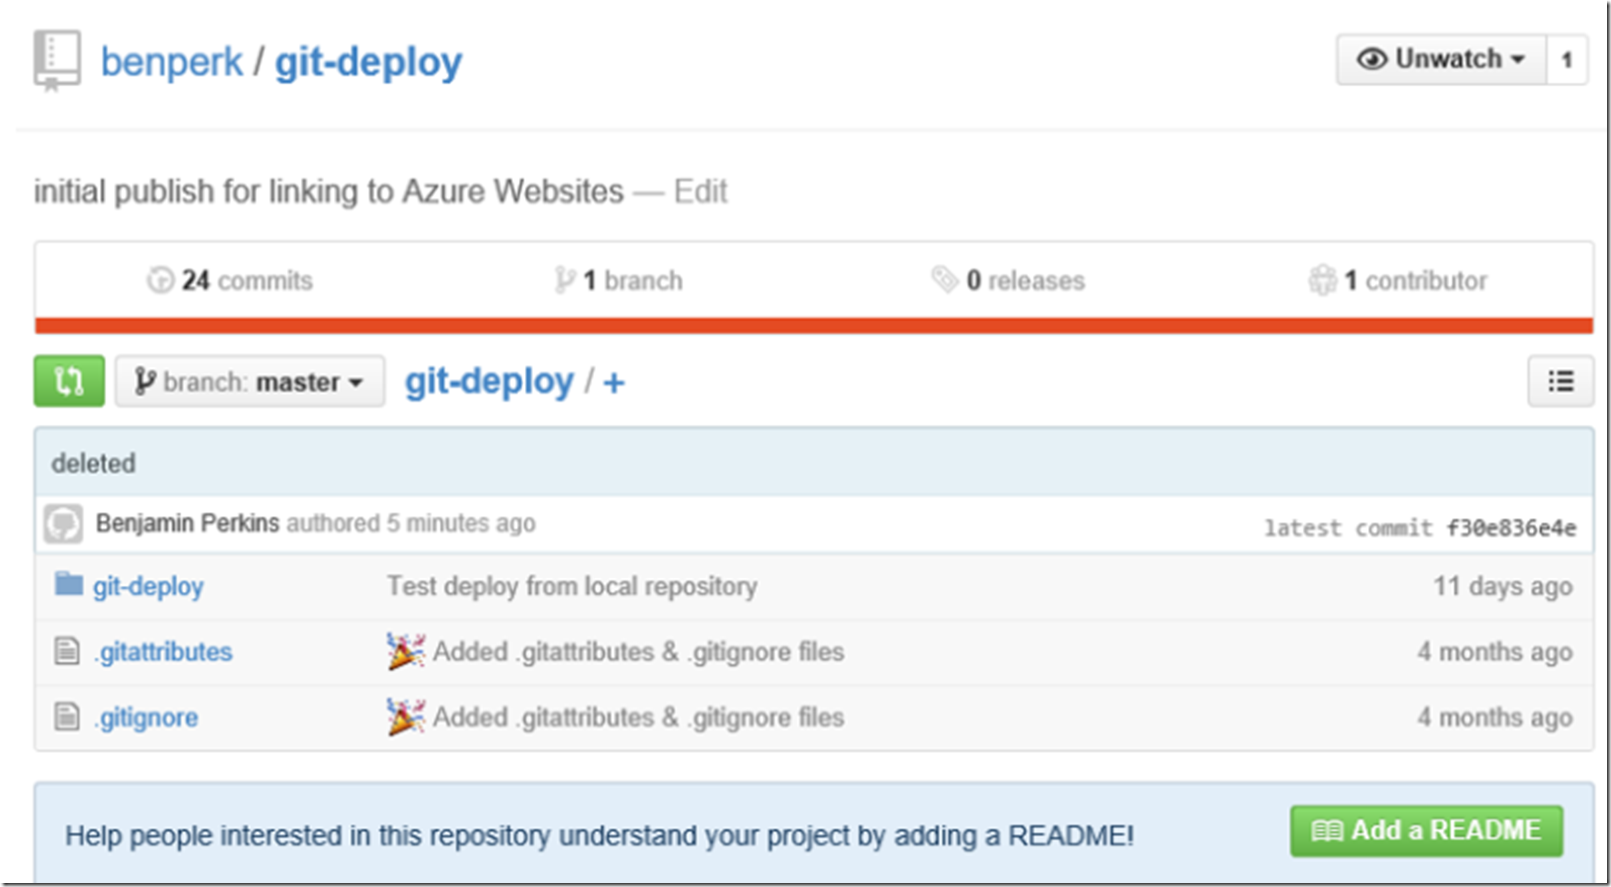
While writing this article and making a suggestion to set the SCM_TRACE_LEVEL=4, I had some difficulty finding out how to create the file and where to put it. Here is how I did it. At the top of the page here, which I have linked to many times in this article there is a link describing the .deployment file and links to here. It mentions that the .deployment file needs to be in the root of the repository. Looking at my repository, I did not have that file, as shown in Figure 20.
Figure 20, it-deploy GitHub content
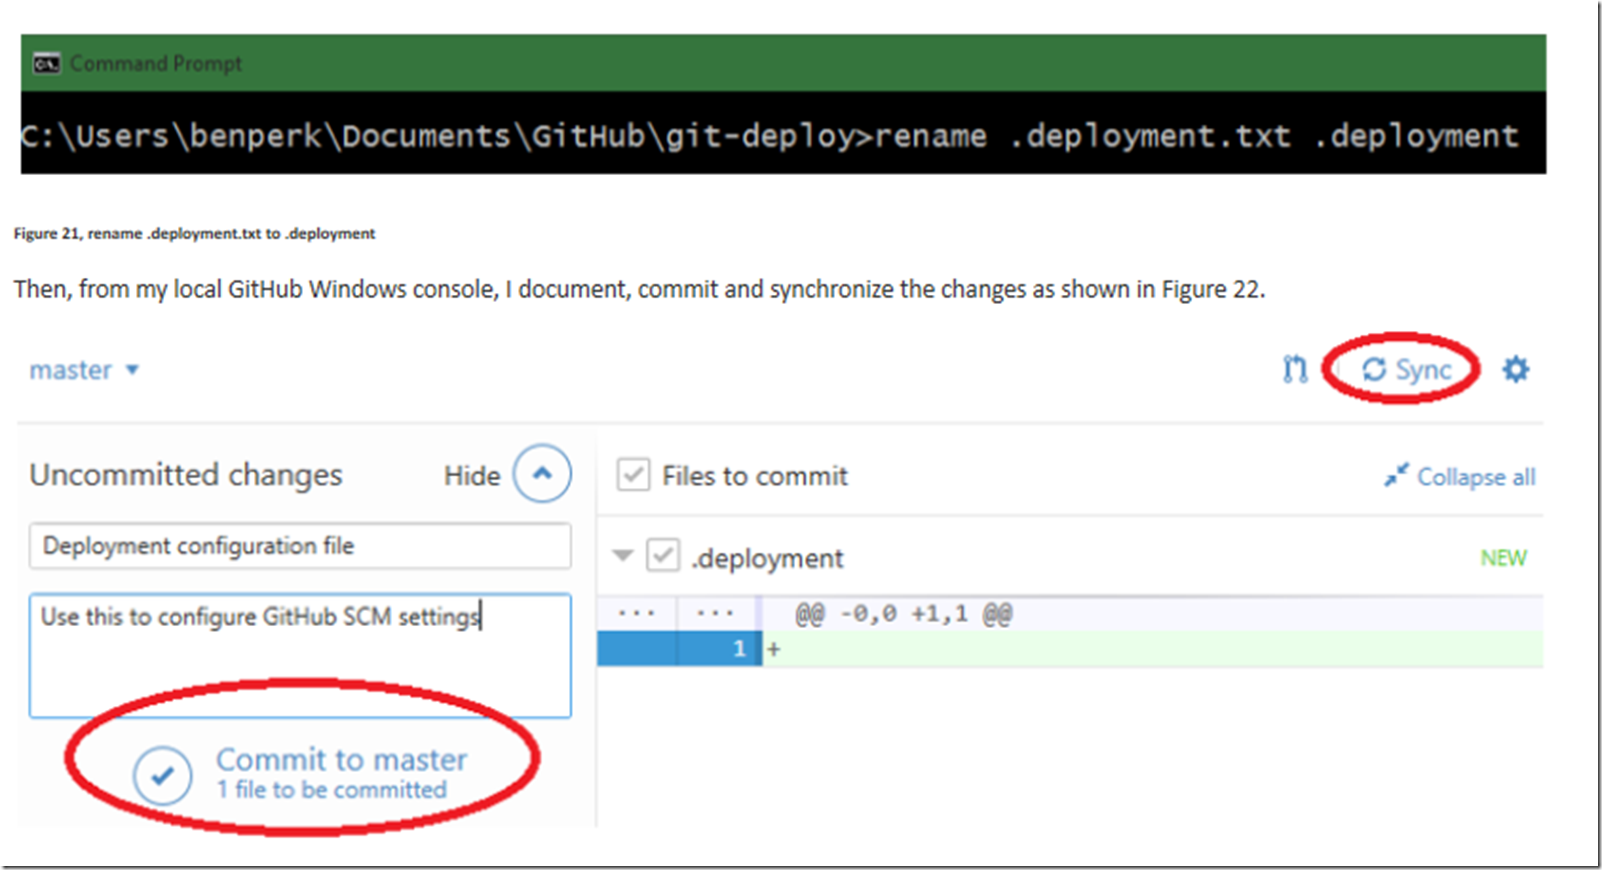
I then places a file named .deployment into my local GitHub repository. I created the TXT file, but had to RENAME the file via a command prompt as shown in Figure 21.
Figure 21, rename .deployment.txt to .deployment
When I refresh my online GitHub, I then see the file as expected. I can make the changes to the .deployment file in my local repository or on the online portal. Once the changes are committed, they are applied to any future deployment.
