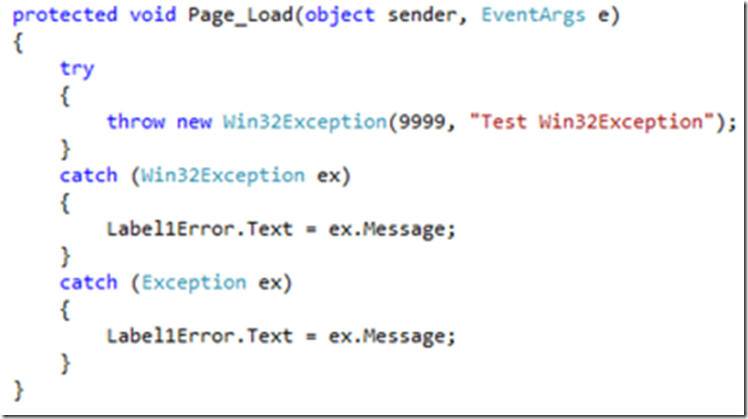
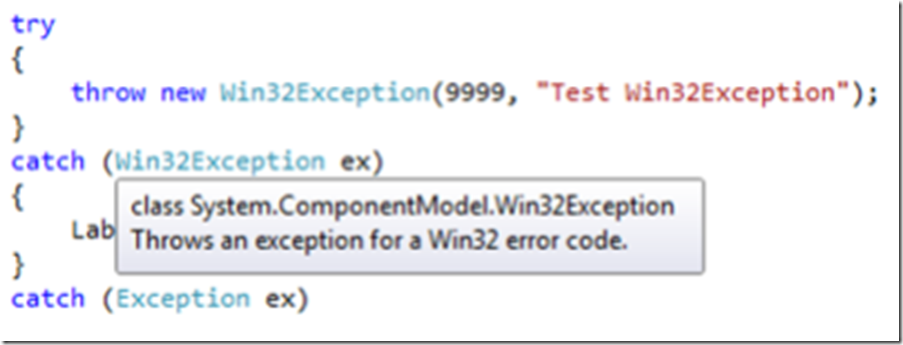
Debugging a process crash is a challenging activity. Although you know the exception type, the exceptions error message and you know the method that it is being thrown from, you still can’t find out why the exception is being thrown. It is especially complicated when the error is happening randomly and you cannot reproduce it. A method for getting to the exceptions root cause is to use Debug Diagnostic to create a dump when that exception happens within a specific process. I will show how to setup Debug Diagnostic to catch a Win32Exceptions from within a W3WP worker process. Download the new 2.0 version of Debug Diagnostic here. The team blog is here, just in case the download link does not work. I wrote a simple website that throws a Win32Exception. The code is shown in Figure 1.
Figure 1, Throwing a Win32Excpetion from an ASPX page
I then take this example program and place it on an IIS7/8 server. I make sure that the program can run and creates the W3WP worker process that I want to configure Debug Diagnostic to monitor. Figure 2 shows the Task Manager window containing the W3WP work process running the application pool Win32Exception.
Figure 1, Task Manager showing W3WP worker process running the Win32Exception application pool.
Next, open Debug Diagnostic and follow these steps:
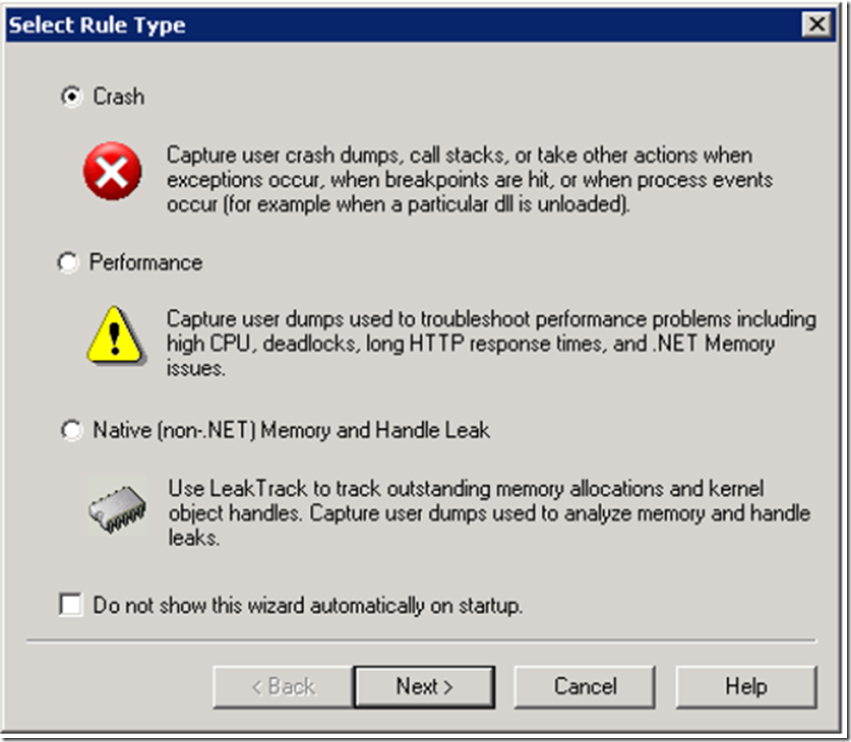
- Select Rule Type: Crash
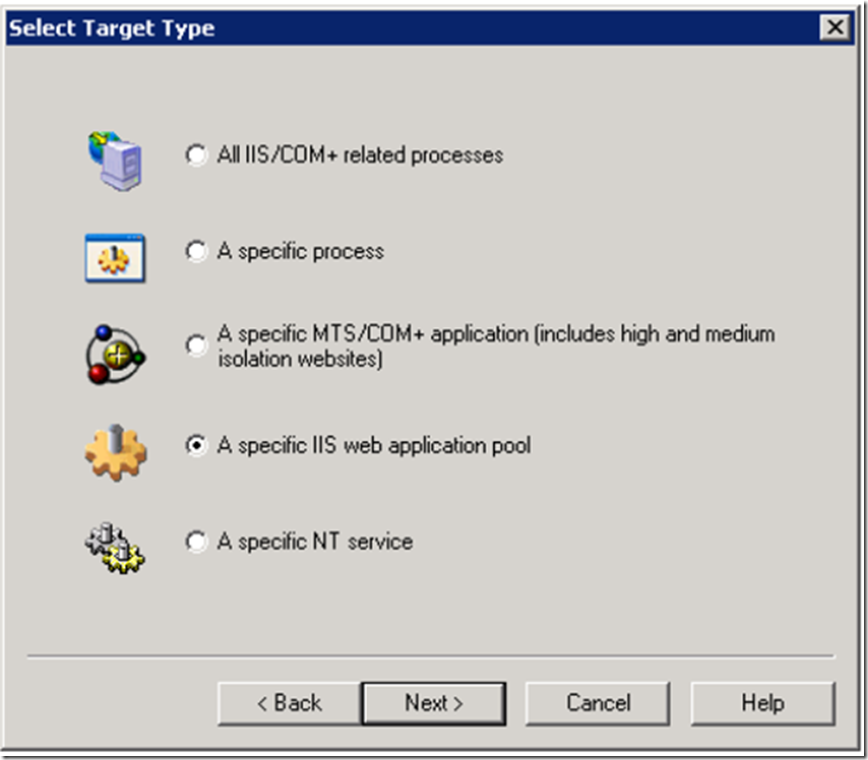
- Select Target Type: A specific IIS web application pool
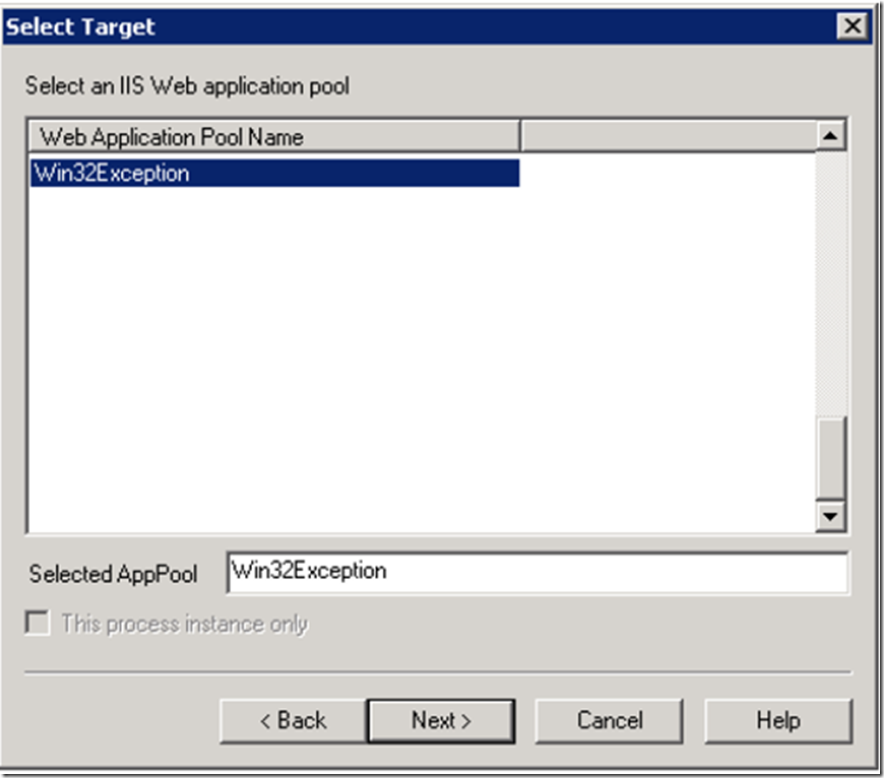
- Select Target:
- Advanced Configuration -> Advanced Settings -> Exceptions…
- First chance Exception Configuration -> Add Exception
- Exception Name: CLR (.NET) 4.0 Exception
- .NET Exception Type: System.ComponentModel.Win32Exception
- Action Type: Full Userdump
- Add Rule Name and Userdump location
- Activate the rule
Step 1
Select the Rule Type, as shown in Figure 3.
Figure 3, Debug Diagnostic – Select Role Type
Step 2
Select “A specific IIS web application pool” as shown in Figure 4.
Figure 4, Debug Diagnostic – Select a Target Type of A specific IIS web application pool
Step 3
Select the target application pool. In the example, I have created a website and application pool called Win32Exception. Figure 5 shows the selection.
Figure 5, Debug Diagnostic – Select Target
Step 4
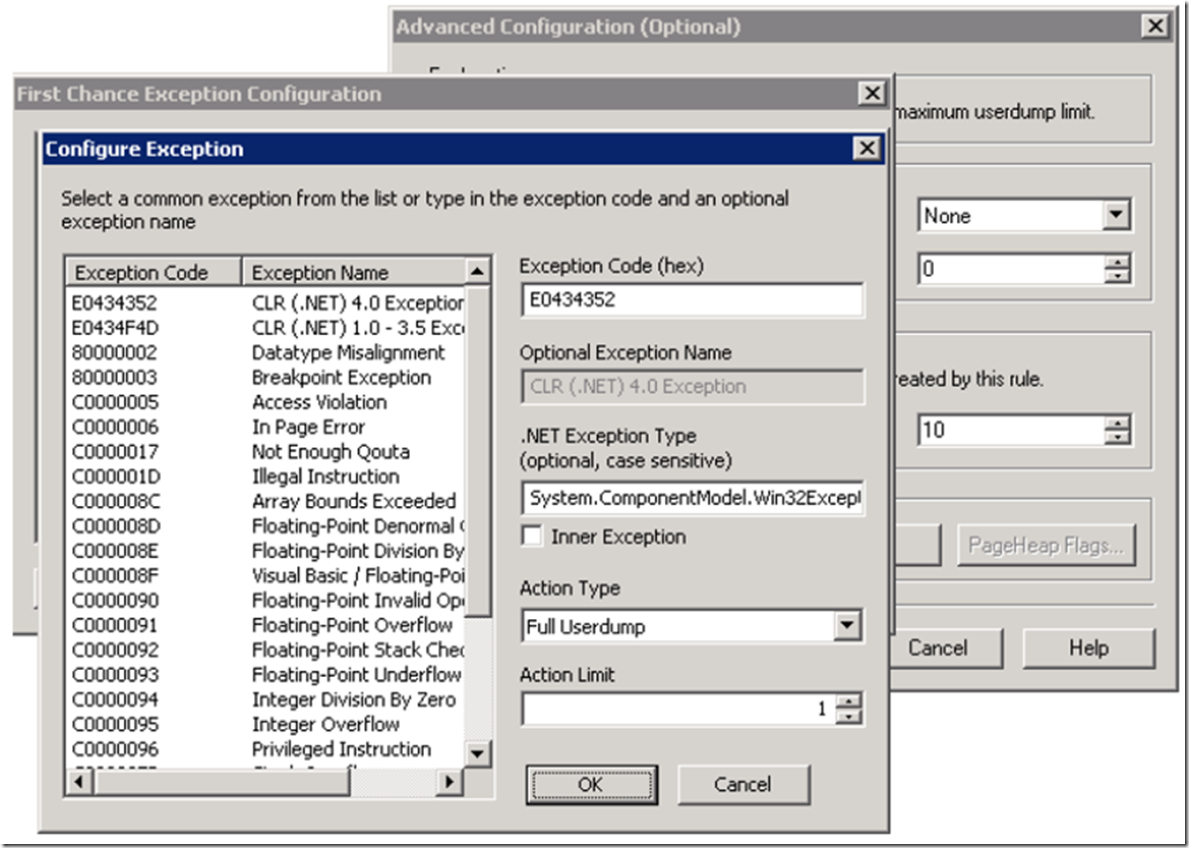
Configure the exception. Leave all the default setting on the Advanced Configuration window as that are. In the Advanced Settings group box select the Exceptions… button -> then the Add Exception… button. Select the CLR version you are using, in this example I am using .NET 4.0 and therefore select “CLR (.NET) 4.0 Exception”. If you are using .NET 2.0 then you should select the 1.0 – 3.5 Exception value.
Once selected a “.NET Exception Type” text box is displayed for you to place the name of the exception you with to monitor for. As you recall, I am trying to capture a Win32Exception that is occurring within my Win32Exception application pool. Note that the value is case sensitive. To be sure I get it correct; I place my mouse over the exception in Visual Studio to get the description and case, as shown in Figure 6.
Figure 6, System.ComponentModel.Win32Excpetion description and case
You can also access the description on MSDN here.
This will show you the correct name, syntax and description. Lastly, select “Full Userdump” from the Action Type dropdown and leave the Action Limit as 1. The final result is shown in Figure 7.
Figure 7, Debug Diagnostic – Configure the Exception
Lastly, name the rule, select where you want the memory dump to be stored and activate the rule.
When I ran the test application that throws the Win32Exception, the Debug Diagnostic Tool resembles Figure 8.
Figure 8, Debug Diagnostic – Rules tab
Now you have a memory dump of the W3WP work process with the Win32Exception application pool. You can now use either the Advanced Analysis tab within the Debug Diagnostic tool or WinDbg to search and find the cause of the exception.
The result will show you the specific method which is throwing the exception. I would then proceed to look at the methods used within the failing method and find which one is capable of throwing the exception.
Solution
Check the parameters of the method and make sure your logic prevents it from receiving values that cause the exception.
