There are many reasons why an application pools’ worker process (W3WP.exe) could be behaving badly. The best approach is to capture some memory dumps during the problem situation and then analyze them. The problem with that is the root cause is not always obvious, even after many hours of analysis and investigation.
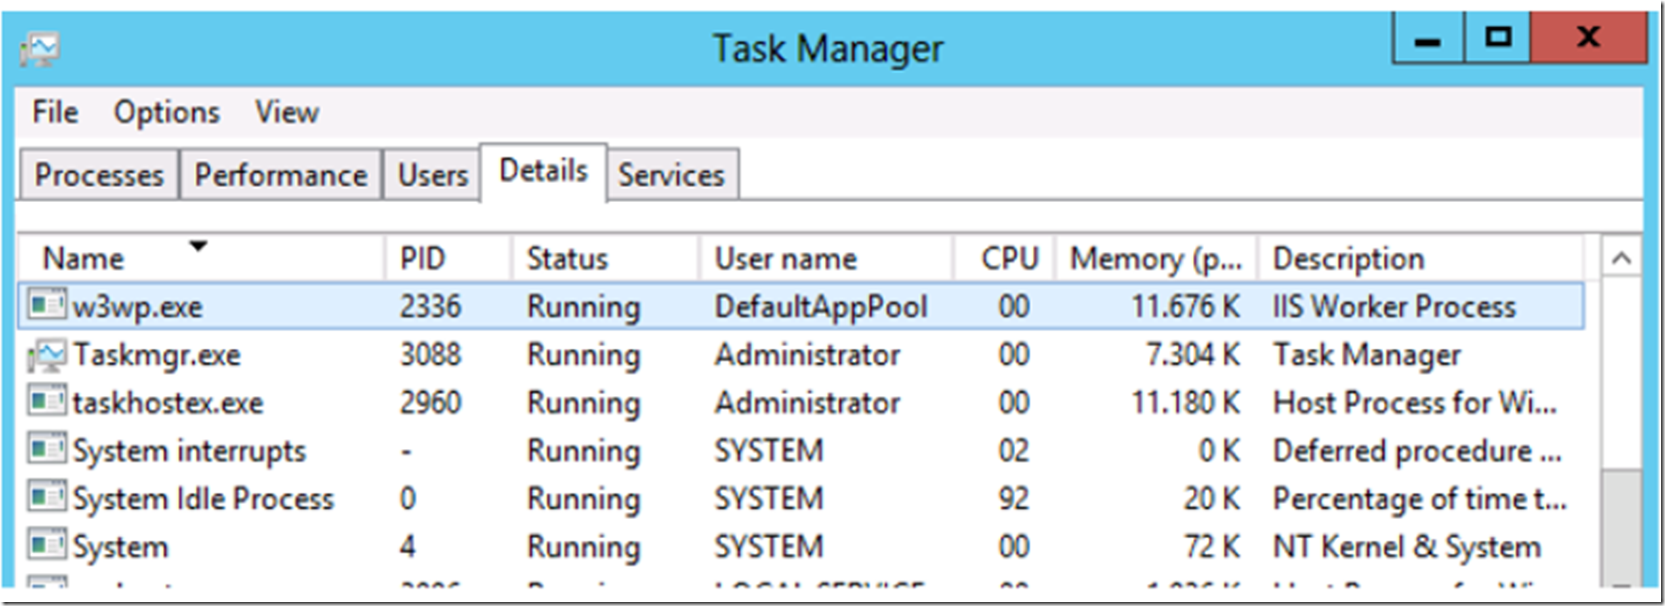
An alternative to memory dump analysis, or maybe a prequel, is to capture and analyze the behavior of the worker process. One of the simplest actions to monitor the application pool is to open up Task Manager and look at the PID of the W3WP.exe process, as illustrated in Figure 1.
Figure 1, the w3wp.exe PID
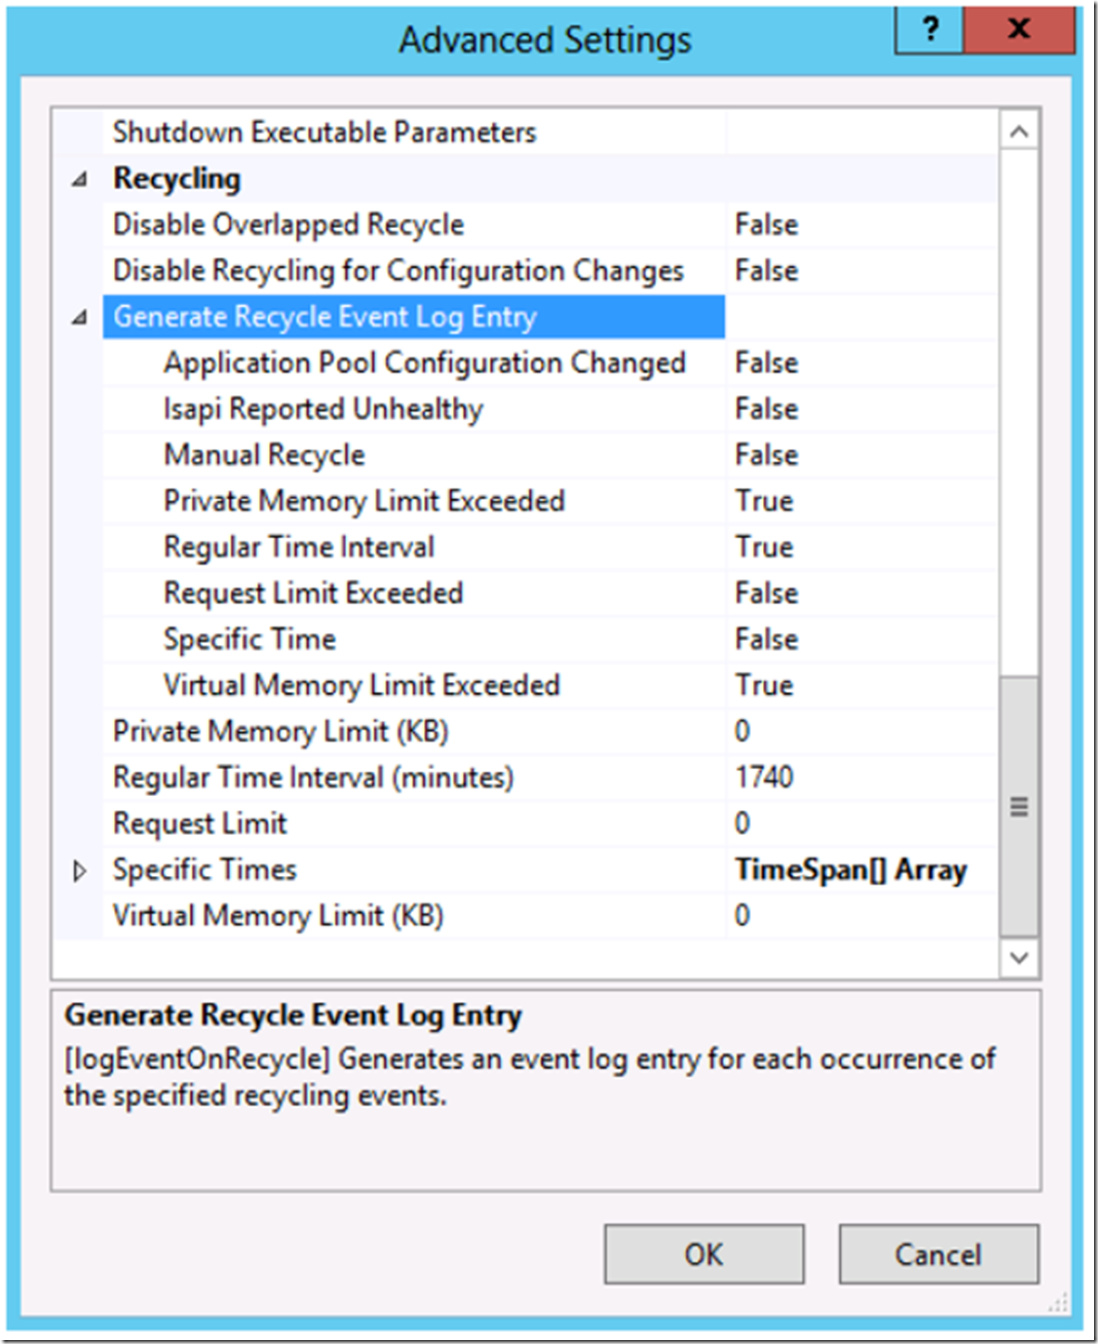
Write down the PID in the morning and then come back a few times during the day to see if the process is restarting. When/if the worker process restarts, it will get a new PID. If you do notice that the worker process is being restarted, consider using the “Generate Recycle Event Log Entry” features available via the Advanced Settings… window for the given application pool. Figure 2 shows the default settings on a Windows Server 2012 IIS 8 machine.
Figure 2, The Generate Recycle Event Log Entry settings
During the troubleshooting phase you might consider enabling all of the attributes to be certain that you capture as much information as possible. However, once you complete your troubleshooting phase, consider disabling the ones you do not find useful in your environment. The description of these attributes are described in the below bulleted list.
- Application Pool Configuration Changed – Event is logged when the application pool recycles due to a change in its configuration
- ISAPI Report Unhealthy – Event is logged because an ISAPI extension has reported itself as unhealthy
- Manual Recycle – Event is logged when the application pool has been manually recycled
- Private Memory Limit Exceeded – Event is logged when the application pool recycles after exceeding its private memory limit
- Regular Time Interval – Event is logged when the application pool recycles on its scheduled interval
- Request Limit Exceeded – Event is logged when the application pool recycles after exceeding its request limit
- Specific Time – Event is logged when the application pool recycles at a scheduled time
- Virtual Memory Limit Exceeded – Event is logged when the application pool recycles after exceeding its virtual memory limits
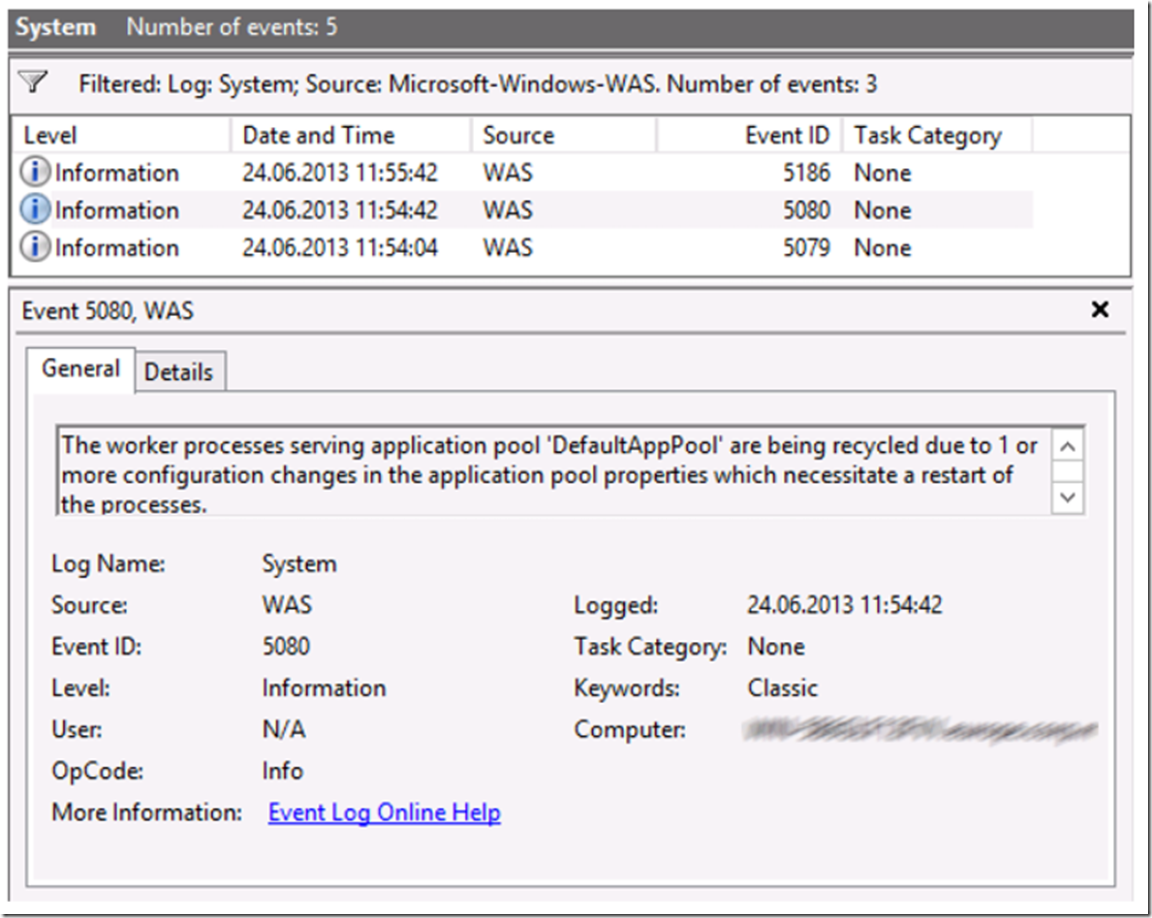
Once configured, you would begin seeing events logged into the System event logs on the IIS server. Figure 3 shows 3 logged events which caused a recycle of the application pools’ worker process.
- Event ID 5186, 5080 and 5079
- Useful link to IIS Application Pool Recycling event ids
Figure 3, IIS Application Pool Recycling events
The recycling of an application pool is in many cases nothing to be alarmed about. However, this is a place to analyze and track when you are experiencing some unexpected behavior. At the same time, if the recycling is happening multiple times throughout the day, you should look into what is causing it to happen as the recycle does have a customer impact. Read this article which digs deeper into appDomain recycles and the impact they can have here.


