Before joining Microsoft, I worked for many years in a large corporation supporting IIS. When there was a disruption of service management always wanted, and needed to know what happened. It is a standard practice that management wants to understand so that actions can be taken to prevent it from happening again.
The OS team, the IIS team, the application team and the network team, maybe even a few more teams were involved depending on the severity of the issue, would need to explain why it was not caused by something in their domain.
It really became an art at finding reasons why it could not have been IIS and must have been the database or a crashing of a hard drive, etc…
This article will focus on an incident where I believe the network latency had something to do with the performance of IIS and/or the system running on IIS.
When I analyze a situation like this I always want these files:
- HTTP Error Logs
- IIS Logs
I use LogParser to analyze the log files. I wrote an IIS troubleshooter here that covers this tool in much more detail.
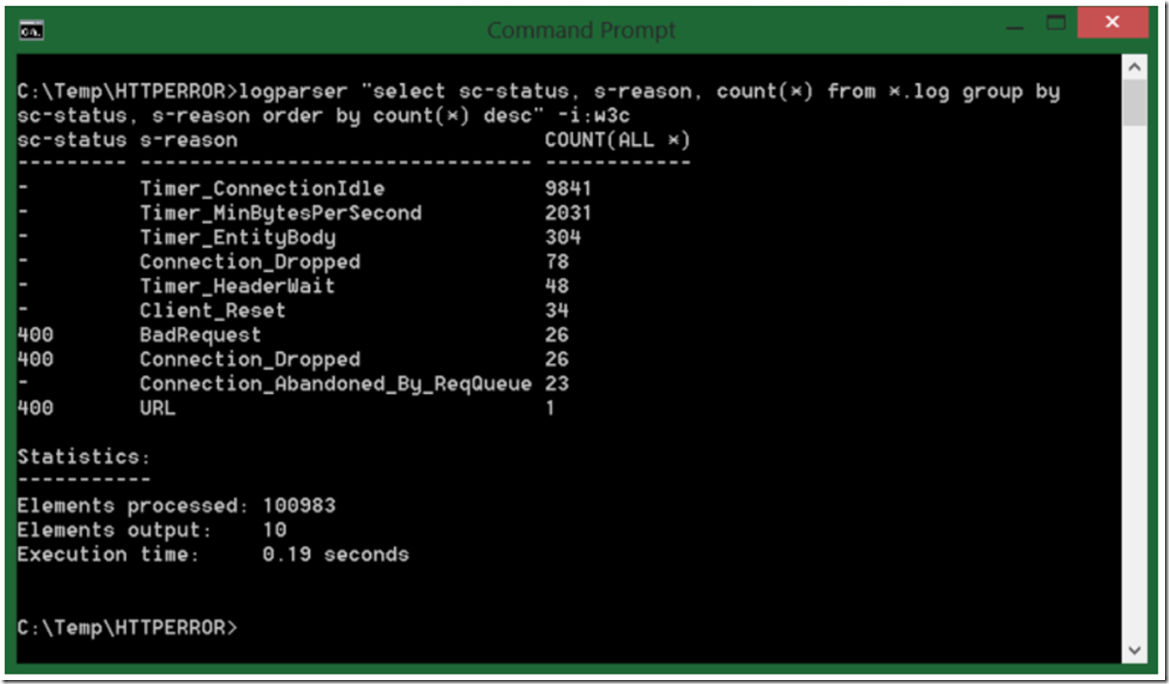
I first look at the HTTP Error log files focusing on the s-reason value. Let’s say I get the following result as show in Figure 1.
Figure 1, looking for a network latency issue in the HTTP Error Log
There are a large number of entries, as you can see. For this example, I am going to focus on the Timer_MinBytesPerSecond reason. A complete description of all the HTTP Error logging reasons can be found here. Table 1 provides the definition of Timer_MinBytesPerSecond found on that web page.
| Name | Description |
| Timer_MinBytesPerSecond | The connection expired because the client was not receiving a response at a reasonable speed. The response send rate was slower than the default of 240 bytes/sec. This can be controlled with the MinFileBytesPerSec metabase property. |
Table 1, Meaning of Timer_MinBytesPerSecond
To me, the reason states that a response for the request is being sent, it is just being sent very slow. I would consider 240 bytes per second slow.
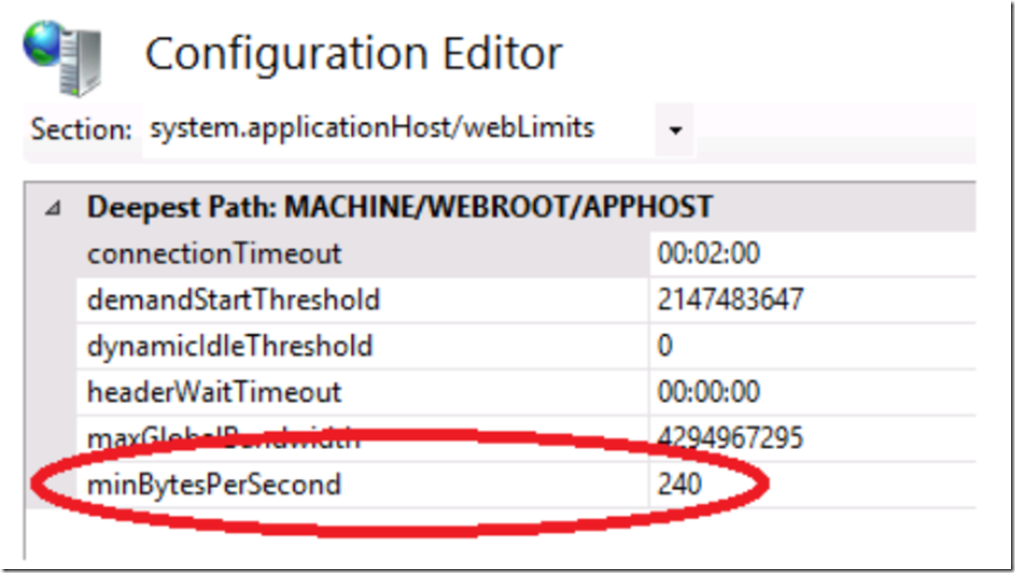
Firstly, it is always a good idea to have the most current supported network card drivers installed on your server. This would prevent, at least any known hardware issue from being the cause. Secondly, although it is possible to reduce the minBytesPerSecond, as shown in Figure 2, it may just postpone the problem into the future. However, in a critical situation, give it shot. NOTE: if you set the value to 0, then the check is disabled.
Figure 2, minBytesPerSecond set to 240
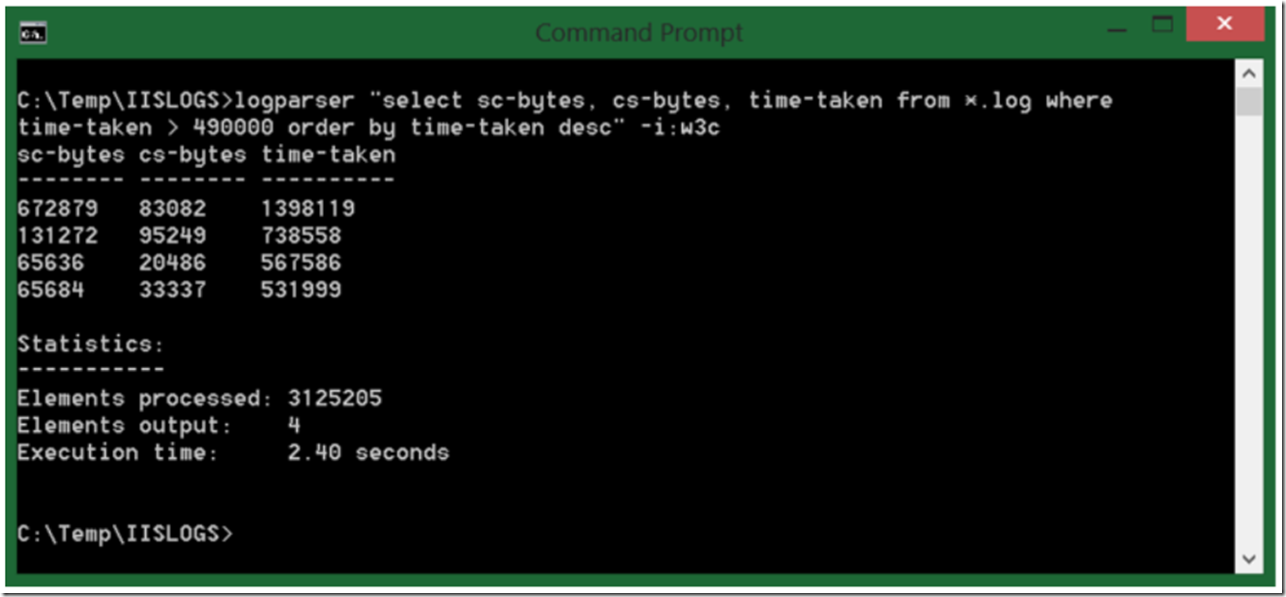
Yes, Yes, OK, could be a number of things causing the slowness. Therefore let’s look next at the IIS logs and then close with an argument supporting our case. Execute the LogParser command shown in Figure 3.
Figure 3, select top time-taken requests from IIS Logs
I did remove cs-uri-stem and cs-uri-query from the query, but you would want to include them so you can see which requested file is taking so long to process and respond successfully. Base on the result in Figure 3, you see that the size of the bytes received and processed (if they are large or not depends on what the system is expecting), but the time-taken is a little big.
My argument would be that if the bytes per second being received is less than 240 and the size are as big as shown in Figure 3, then for sure there is slowness, you can see this with the time-taken value. But the fact that I can bring the 240 value into the argument that to me means that the stream of data moving between the servers is slower than 240 bytes per second, just makes it that much stronger.
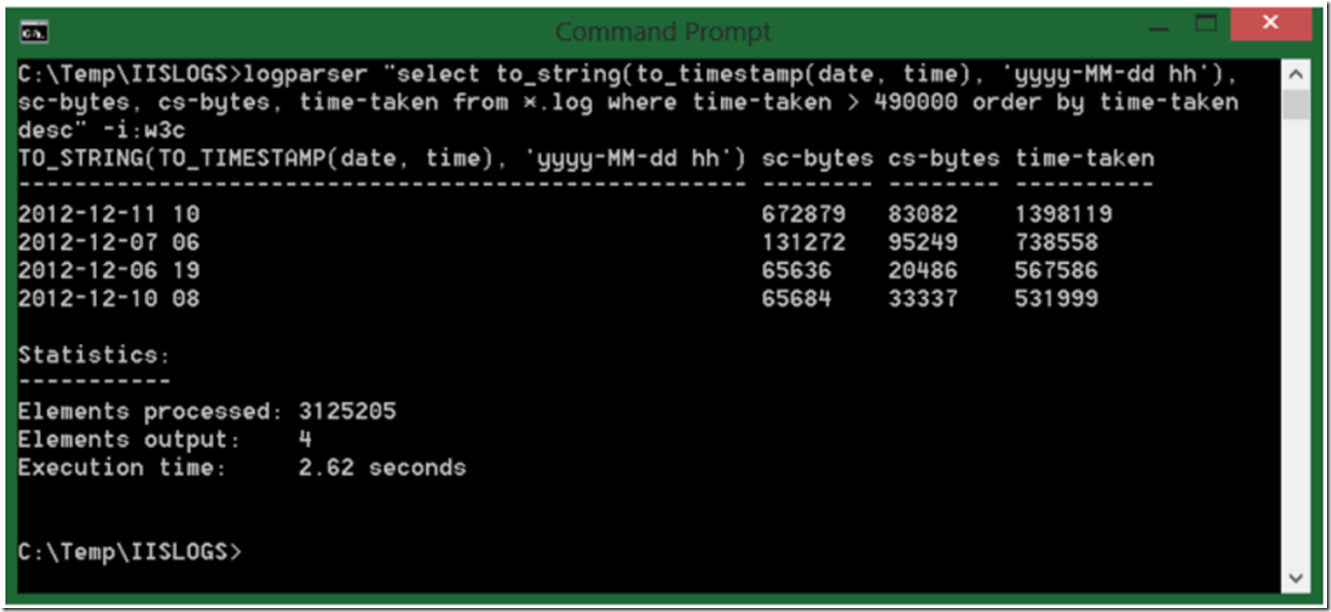
Well, maybe the time of the minBytesPerSecond breach happened at a different time than the results should in the IIS log. Good point. Figure 4 shows a good LogParser query to counter, and hopefully prove that they did happen in the same timeframe.
Figure 4, using to_timestamp in LogParser to find the time when the log is written
You simply need to add “to_string(to_timestamp(date, time), ‘yyyy-MM-dd hh’)’ to the SELECT statement. Do the same to the HTTP Error log query and compare the timeings. If the time matches then more strength for the argument. At least to this point I would be confident that IIS is safe. I hope you would feel the same.
Additional opinion
Taking the above into consideration, there may have also been events written into the event logs or presented to the users with this error:
System.Web.HttpException: Request timed out.
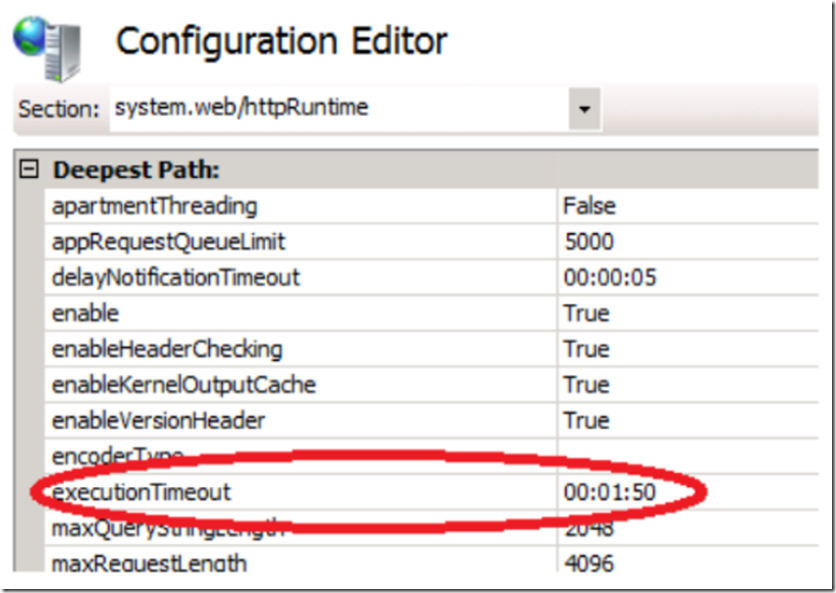
I can explain this because the executionTimout, as shown in Figure 5 has likely been breached. Consider that the network is sending data at less than 240 bytes per second and the file being processed is almost 1MB. It would take much more than the 1:50 set for this attribute to complete.
Figure 5, executionTimeout attribute, Request timed out.
